- Regional Support Office for Asia and the Pacific (RSOAP)
- Member States in Asia and the Pacific
- SUSTAINABLE TOURISM OBSERVATORIES (INSTO)


World Tourism Barometer: September 2022
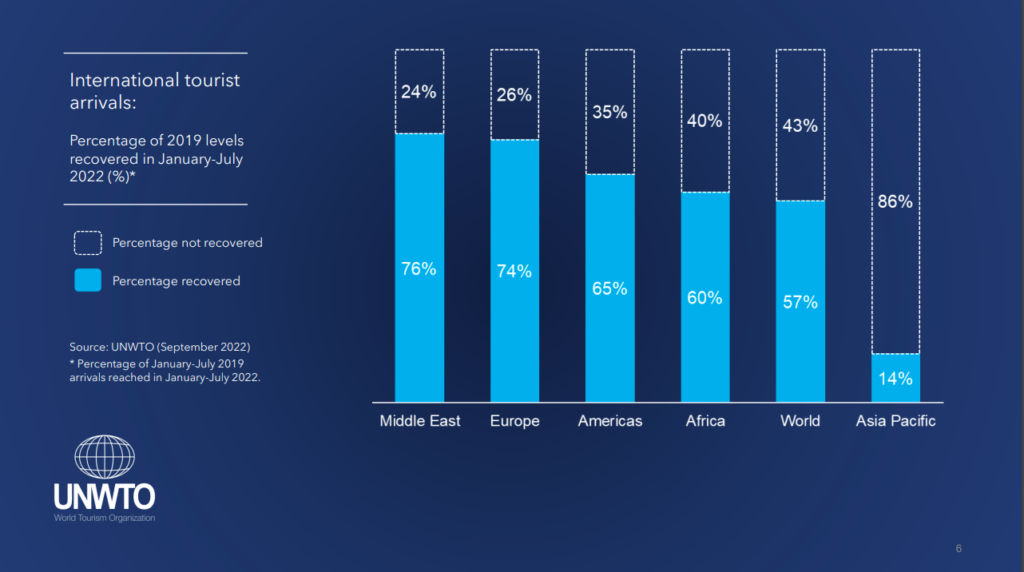
UNWTO updates World Tourism Barometer and reports international tourism back to 60% of pre-pandemic levels from January to July 2022
Below are excerpts from the September 2022 release of the UNWTO Tourism Barometer :
- The steady recovery reflects strong pent-up demand for international travel, especially in the months of June and July which are part of the Northern Hemisphere summer season. The easing or lifting of travel restrictions in an increasing number of countries also contributed to boost results.
- International tourist arrivals almost tripled (+172%) in January-July 2022 compared to the same period of 2021. Numbers climbed from -64% in January 2022 (versus 2019) to -28% in July, the strongest month since the start of the pandemic.
- Asia and the Pacific (+165%) saw arrivals more than double in the first seven months of 2022, though they remained 86% below 2019 levels.
- The ongoing recovery can also be seen in outbound tourism spending from major source markets. Expenditure from France was at -12% in January-July 2022 compared to 2019 while spending from Germany stood at -14%. International tourism spending remained at -10% in Belgium, -23% in Italy and -26% in the United States.
- The uncertain economic environment seems to have reversed prospects for a return to pre-pandemic levels in the near term. 61% of UNWTO Panel of Experts now see a potential return of international arrivals to 2019 levels in 2024 or later while those indicating a return to pre-pandemic levels in 2023 has diminished (27%) compared to the May survey (48%).
Know more about the global tourism sector performance from January to July 2022 by checking the UNWTO World Tourism Barometer Volume 20, Issue 5 .
LEAVE A REPLY Cancel reply
Save my name, email, and website in this browser for the next time I comment.
Regional Support Office in Asia and the Pacific (RSOAP)
Rsoap a to z.
- Sustainable Tourism Observatories(INSTO)
UNWTO A to Z
- About UNWTO
- Affiliate Members
- Member States
- Tourism in the 2030 Agenda
- World Tourism Day
- Technical Cooperation
- ASIA AND THE PACIFIC
- MIDDLE EAST
- RESOURCES/SERVICES
- Sustainable Development of Tourism
- Ethics, Culture and Social Responsibility
- Market Intelligence
- Tourism Data Dashboard
- Publications
- UNWTO Academy
Partners links

© UNWTO Regional Support Office for Asia and the Pacific (RSOAP)
- Publications
- Key Findings
- Interactive Data and Economy Profiles
- Full report
Travel & Tourism Development Index 2021: Rebuilding for a Sustainable and Resilient Future

4. Key findings

Several key findings have been identified in the Travel & Tourism Development Index (TTDI) 2021 results and research. First, the need for T&T development has never been greater as it plays a critical role in helping the global economic recovery by supporting the livelihoods of some of the populations hardest hit by the pandemic and by building resilience, especially when it comes to lower-income countries. Moreover, by investing in the factors that help drive T&T, many economies can leverage tourism to further their overall development. The need for T&T development has never been greater as it plays a critical role in helping the global economic recovery.
Second, the key findings show not only how ongoing challenges such as reduced capacity and labour shortages are tempering the recovery but also how shifting demand has created opportunities, forcing many T&T businesses and destinations to adapt, highlighting the sector’s impressive flexibility. Third, the analysis explores in more detail how various aspects and drivers of T&T development can be more thoughtfully and effectively considered and employed to bolster the recovery and build a more inclusive, sustainable and resilient T&T sector.
4.1 The need for Travel and Tourism development has never been greater
The case for t&t development.
As already alluded to in the global context section above, the T&T sector’s significant contribution to global economic and social development makes its recovery and long-term growth paramount. In 2019, the sector’s direct, indirect and induced output accounted for about 10% of global GDP. Moreover, for many emerging economies, T&T is a major source of export revenue, foreign exchange earnings and investment. On average, out of the economies covered by the TTDI, T&T contributed 70% more towards the exports of middle-income economies than to the exports of high-income economies in 2019. 10 Consequently, restoring T&T sector growth will be particularly vital for developing economies’ recovery. For instance, the World Bank forecasts that emerging markets and developing economies (EMDEs) will not return to pre-pandemic economic output trends until after 2023, with more than 80% of tourism-reliant EMDEs still below their 2019 economic output at the end of 2021. 11 Recent concerns about the slowdown in globalization and trade due to the impact of the pandemic and geopolitical tensions 12 further enforce how important T&T is for global connectivity.
It is also important to note that T&T is vital not only to overall economic performance but also to the livelihood of some of the populations and businesses most vulnerable to, and hardest hit by, the pandemic. This sector contributed to about 10% of global jobs in 2019, 13 employs almost twice as many women as other sectors, has a large share of youth employment and is a major source of jobs for minorities, migrants, informal workers and low-skilled workers. 14 Moreover, SMEs account for more than 80% of T&T businesses. 15 Unsurprisingly, research has shown that T&T growth can support social progress and create opportunities and well-being for communities. 16 Consequently, investing in T&T could not only mitigate the impact of the pandemic but also improve socioeconomic progress and resilience.

Enabling the T&T development landscape
With the case for T&T’s recovery and development clear, it will be critical to focus on and invest in the factors and policies (beyond the critical need for vaccine distribution) that can help enable these goals, many of which are measured by the TTDI. World Economic Forum research shows that TTDI performance correlates with direct T&T GDP, international tourist arrivals and receipts. 17
Figure 3: Travel and Tourism economic and enabling development landscape

Figure 3 can help us understand which economies are likely to be best positioned from a T&T recovery and resiliency point of view, and which may need to prioritize greater investment in T&T enabling factors. This is illustrated by comparing the TTDI scores to economic dependence on T&T. Low- and middle-income economies tend to score below the TTDI average, indicating a potential constraining factor for their economic recovery. In particular, economies in the bottom-right quadrant would gain the most by investing in the drivers of T&T development because they are more dependent on the sector for economic development. Such investment will help their economic recovery by enabling stronger tourism growth as well as supporting their overall economies to be more robust and resilient. On the other hand, while economies in the bottom left are less dependent on T&T, their below-average TTDI score may indicate that their conditions are leading to an underuse of the sector’s ability to drive development, weakening their economic potential – a resiliency issue in itself.
Higher TTDI scores for economies in the top two quadrants indicate that they are more mature markets and are best positioned for the sector’s recovery. Countries in the top-left quadrant are in a more optimal position from a resiliency point of view as they have favourable conditions for T&T operations but are also less reliant on it for their overall economic performance. However, that is not to say that T&T does not play an important role in their overall economic development, especially at the local level and for specific segments of the labour force and SMEs. Meanwhile, economies in the top-right quadrant, like those below them, have also been more vulnerable to the impact of the pandemic, especially given that analysis shows they are typically more reliant on the export of T&T services. These factors may limit their ability to recover economically from the pandemic, but they are also better positioned to generate tourism-led economic growth as international tourism returns. In general, for the most mature T&T countries such as those higher in the top quadrants, sector performance and resilience may be less about making major improvements in aspects of T&T development such as infrastructure and more about continuously calibrating their T&T strategies to adapt to changing demand dynamics, local needs and overall T&T trends.
Figure 4: TTDI 2021 pillar performance

Figure 4 shows in more detail what gaps remain to achieving improved T&T performance and development for various countries. High-income economies and countries in the Europe and Eurasia (Europe) and Asia-Pacific (APAC) regions tend to lead the overall index in results. Among the largest differentiators between index leaders and laggards are: the distribution and promotion of natural, cultural and non-leisure assets and activities; the availability of quality transport and tourist service infrastructure; the degree of international openness; and favourable factors such as (increasingly important) ICT readiness and health and hygiene. However, as shown in the Travel and Tourism Competitiveness Report 2019, because T&T growth is so dependent on factors such as infrastructure and health and hygiene, which if improved bring benefits to more than the tourism sector, sector leaders can play a valuable role in encouraging investment that benefits a country’s economy as a whole. This is especially true for developing economies that have innate natural and cultural assets around which to mobilize investment. 18 The next section detailing key findings will use the TTDI results to discuss the T&T challenges and opportunities created over the past few years, as well as examining how various drivers of T&T development can be employed to bolster T&T recovery and build a more inclusive, sustainable and resilient T&T sector, thereby unleashing its potential for economic and social progress.
4.2 Recovery challenges and shifting demand dynamics
The results highlight difficult operating conditions.
While varying greatly based on local, segment, national and regional conditions, the TTDI results and research help highlight some of the various and common operational challenges the T&T sector faces in its recovery.
With T&T activities being severely restricted over the past few years, the greatest decline in index performance has come from the contraction of related operations and investment. As such, average scores fell in the Air Transport Infrastructure (-9.4%), Prioritization of Travel and Tourism (-6.7%) and Tourist Service Infrastructure (-1.5%) pillars. Air route capacity and airport connectivity plummeted, especially in more mature and high-income economies. Similarly, the decline in tourist service infrastructure reflects initially reduced capacity in the accommodation and related segments. The average number of per capita short-term rental units dropped by about one-fifth between mid-2019 and 2021 across economies ranked in the index. 19 While not reflected in the TTDI results, STR data indicates that, over a similar timespan, the number of hotel rooms did not recover to pre-pandemic levels in many countries. 20 In line with these trends, both T&T capital investment and government T&T expenditures also fell. The decline in sector capacity has also been compounded by the fact that most businesses are SMEs and do not have the means to survive prolonged drops in demand or restrictions on person-to-person contact. The disproportionate impact of the pandemic on the sector is indicated by the direct T&T contribution to global GDP falling from 3.2% to 1.6% and the contribution to global employment falling from 3.8% to 3.1% between 2019 and 2020. 21
Figure 5: Select pillar 2019 to 2021 average score change

Yet, as demand resumes in line with easing travel restrictions and somewhat improving COVID-19 conditions, the initial reductions in capacity increase the potential for supply-side constraints. In advanced economies, in particular, rising demand, earlier layoffs that disproportionality hit T&T, and competition for talent with other sectors have resulted in widespread labour shortages. A WTTC report focusing on the United States, the United Kingdom, France, Spain, Italy and Portugal estimates that the T&T sectors in these countries experienced staff shortfalls ranging from 9% to 18% in 2021. 22 The interconnected nature of the T&T supply chain and ecosystem has also created challenges. Hotels, airlines, car rental firms, tour operators, cruise lines and others all form a chain of service providers dependent on each other along the traveller journey. Bankruptcies or other disruption issues at any point along this chain have the potential to negatively affect the others.
"In addition to labour shortages and capacity constraints, the sector has also been exposed to broader global disruptions that are complicating recovery."
Over the course of the pandemic, growth in merchandise trade coincided with production, worker, equipment and space shortages to create a global supply-chain crisis. For instance, hotels have faced shortages of items ranging from slippers for clients to kitchen equipment. 23
The recent outbreak of war in Ukraine and resulting sanctions and travel restrictions related to Russia have added further pressure on the recovery. Airlines around the world have had to reroute operations, increasing travel times and costs. Meanwhile, the still fragile recovery in international tourism demand could be tempered by increased hesitancy among travellers when it comes to visiting Europe. 24 Many T&T economies in Europe, Eurasia and beyond may also be hard hit due to reduced demand from Russia and Ukraine. Combined, these two economies account for about 3% of international tourism spending, with Russia having been a major source of visitors to destinations ranging from Azerbaijan, Georgia and Turkey to Israel, the United Arab Emirates and Thailand. 25
While not yet fully reflected in the TTDI’s Price Competitiveness pillar, rising travel demand, the stated labour, capacity and other shortages, global supply-chain disruptions and rises in fuel prices and inflation caused by factors such as the war in Ukraine will likely increase costs and service prices throughout the entire T&T supply chain and ecosystem. For example, as of 13 May 2022, jet fuel prices were more than double what they were a year ago, 26 and if they remain high, airline yields and ticket prices will likely rise. 27 Recent UNWTO analysis cites how conflict-induced uncertainty, higher energy and food prices and inflation, in general, are putting pressure on consumer purchasing power and tempering global economic growth, potentially affecting T&T sector performance. Moreover, as economies such as the United States combat inflation by increasing interest rates, consumer demand and T&T investment may be further hit by the rising cost of credit. 28
The pandemic shifts demand dynamics, creating opportunities and driving adaptation
With travel restrictions still common and traveller confidence hampered by pandemic concerns, the past few years have also seen a shift in demand trends in global T&T. According to the UNWTO Panel of Experts, the major trends driving the T&T recovery include domestic tourism, travel close to home, open-air activities, nature-based products and rural tourism. 29 The World Travel and Tourism Council (WTTC) data shows that, on average for the 117 economies covered by the index, domestic spending’s share of T&T spending increased from 50.8% in 2019 to 62.6% in 2020 as domestic demand fared better than collapsing international demand. 30 Moreover, current projections for 2021 show that domestic spending growth is expected to substantially outpace international spend in every region outside of the Caribbean and Middle East. 31
The TTDI results further reinforce the shift in demand dynamics that the world has witnessed. The second most improved pillar is Natural Resources (+2.5% average score increase). While this was driven largely by an expansion in the number of recognized UNESCO World Heritage natural sites and protected areas, such as national parks, the greatest improvement has come from destinations’ ability to garner interest in nature-related segments as illustrated by the 20.8% average growth in natural tourism Digital Demand value, a measure of online searches for topics such as natural wonders, outdoor activities and rural accommodation.

On the other hand, the Non-Leisure Resources pillar had one of the greatest declines in average performance (-1.9%) as business travel declined. While this sector is recovering, it has rebounded at a slower rate than leisure, with factors such as workplace flexibility and the availability of virtual alternatives for in-person meetings tempering demand and potentially leading to some permanent loss in corporate travel. This will force many T&T segments to adapt. For example, operators in the meetings, incentives, conferences and events (MICE) area may have to rely more on smaller and hybrid events. 32 T&T businesses and destinations are increasingly looking to capture opportunities offered by the changing nature of work. Over the course of the pandemic, more businesses have gone virtual, and an increasing share of the labour force is becoming independent.
"In 2020, 10.9 million Americans said they were digital nomads, a 49% increase from 2019."
This sample of independent workers is also increasingly willing to travel. A recent survey showed that the share of US independent workers doing business outside the country jumped from 12% in 2013 to 28% in 2020. 33 Additionally, the trend in “bleisure” travel – the addition of leisure activities to business trips – is also growing. 34
To cater to these growing markets, T&T businesses will have to become more flexible and create new, innovative products. For instance, some major hospitality groups are creating new long-stay properties that include kitchens and living spaces, while other have introduced packages that offer reduced rates for those staying longer, which include IT and boardroom services. 35 Furthermore, while virtual business may require less office space, corporations and their employees may need options for occasional company meetings and events that the sector could provide. However, it is important to note that these new market opportunities are primarily for the high-end travel market and are not likely to replace the overall loss in business travel. Lastly, T&T operators have also had to introduce more flexible booking and cancellation policies in order to address uncertainty about travel regulations and the pandemic, in addition to increased consumer desire to make last-minute changes or to add leisure stays to their business trips. 36
From a destination point of view, many governments have also adapted to changing conditions to take advantage of shifting demand dynamics. For one thing, many countries have provided various incentives to boost domestic tourism. For example, Hong Kong, Singapore, South Korea and Japan have rolled out various programmes that provide discounts, coupons and subsidies for domestic travel. 37 Meanwhile, Aruba targeted the digital nomad market through extended work visas and other benefits via its One Happy Workation programme. 38 The trends towards more rural and nature-based tourism also offer an opportunity for less-developed economies to harness the benefits of T&T given that the distribution and quality of natural assets are less tied to overall economic development, with Natural Resources being one of the few pillars where non- high-income economies typically outperform high- income countries (see Figure 6).
Figure 6: Composition of top quartile, by income group

Overall, the above adaptations to shifting demand and COVID-19 conditions help highlight how flexible T&T business and destinations can be in times of crisis. As the sector rebuilds and addresses future risks, its adaptability will become more crucial than ever. In particular, as can be seen in the key findings that follow, the shift to domestic and nature-based travel, as well as other trends, coincides with an increased emphasis on sustainable and safe travel. Therefore, T&T development will have to become increasingly sustainability-oriented.
4.3 Building back better
Given the current challenges, shifting demand dynamics and future opportunities and risks, it is vital that T&T development strategies are employed to rebuild the sector in a more inclusive, sustainable and resilient manner.
Restoring and accelerating international openness and consumer confidence, including investment in health and security
For starters, as travel restrictions are removed, ensuring that T&T markets are open to visitors and investors will become vital. In particular, it is important that the historical trend of ever greater international openness in T&T continues. Reduced visa requirements fuel international tourism and additional air service agreements open up markets to more airlines, routes, competition and, ultimately, better service (see Figure 7). Given the recent decline in international route capacity and travel demand, prioritizing visa and air service agreement liberalization will be important – with those economies most dependent on tourism exports and lacking large domestic markets standing to benefit the most. Financial openness and an increase in regional trade agreements can also help to facilitate necessary cross-border investment in T&T and beyond, which may also help encourage more international and intra-regional travel.
TTDI results indicate that Western, Southern and Northern Europe are usually the most internationally open subregions due to the close integration that the European Union, the Schengen Area and similar blocs and agreements provide. Such systems allow T&T operators to benefit from factors such as a larger and more diverse consumer base and common market rules. It is also important to recognize that despite the pandemic and disrupted global trade, 83 economies ranked in the index increased their number of regional trade agreements in force between 2019 and 2021. Relevant recent developments include the African Continental Free Trade Area (AfCFTA), which came into force in 2021. Combined with related efforts such as the Free Movement Protocol and Single African Air Transport Market (SAATM), the sub-Saharan Africa region has the potential to unlock its untapped T&T potential and grow its underdeveloped intra- regional T&T market and air route capacity. 39
Figure 7: Correlation between air service agreement liberalization and air transport infrastructure, 2019

Endnotes 40 , 41
Of course, the pandemic, along with the recent rise in geopolitical tensions, also highlights just how important health and security conditions are to protecting the openness on which T&T relies and to restoring consumer confidence in travel. Economies with sophisticated healthcare systems are better equipped to mitigate the impact of pandemics on T&T and the wider economy by protecting their populations, including the T&T workforce and visitors, thus reducing the need for travel and lockdown restrictions. Meanwhile, access to clean water and sanitation facilities helps prevent diseases or their spread. Lastly, consumers and business travellers are likely to remain more sensitive to the health and hygiene conditions at destinations for some time. A recent survey shows that the majority of travellers consider safety protocols, restrictions and cleanliness to be key factors in travel decision- making. 42 In the short term, T&T business, destinations and international organizations have responded to these issues via actions such as the introduction of various protocols and certifications. For instance, the World Travel & Tourism Council has introduced the Safe Travels protocols and certification stamp that can be used by T&T to show customers they are following standardized global health and hygiene practices. 43
In general, underdeveloped health and hygiene infrastructure and access represents an acute challenge for many developing countries, with low- and lower-middle-income economies scoring 50.0% and 25.6% below average in the Health and Hygiene pillar. These states lack physicians and hospital beds (in terms of ratio to population size) and access to basic sanitation and drinking water, and such issues, combined with lower vaccination rates, mean that these economies will struggle to recover at the same pace as others and will have difficulty building adequate resilience against future health security risks. It is therefore crucial for the success of the global T&T sector that the challenges related to vaccine distribution and roll-out are addressed in an equitable and inclusive fashion. While further effort is required, public-private cooperation can provide a useful avenue to address this challenge. For example, the World Economic Forum’s Supply Chain & Transport Industry Action Group community, which consists of leading supply-chain companies, is supporting UNICEF and the COVAX Vaccine Distribution programme with “planning, preparedness and prioritized transportation and distribution of COVID-19 vaccines and related supplies”. 44

The above-mentioned introduction of travel bans, flight-route adjustments, increasing fuel and food prices and potentially hindered international travel demand caused by the war in Ukraine have also shown the degree to which international T&T can be affected by geopolitical tension and conflict. Overall, it is well established that crime and security issues such as terrorism and conflict have a negative impact on tourist arrivals and sector revenue. 45 The 2021 TTDI data shows that economies in the Americas, sub-Saharan Africa and South Asia tend to score the lowest for safety and security, thereby creating a further obstacle to the future development of T&T in these areas.
On the other hand, research has also shown that a sustainable and open tourism sector can be resilient to violence and conflict and that it may help foster positive peace, namely the “attitudes, institutions and structures that create and sustain peaceful societies”. More specifically, the mechanisms through which tourism can accomplish this include cultural and information exchange, encouragement of tolerance, better government functioning, human capital development, and local and cross-border economic gain that can reduce the risks to peace. 46 It is now more important than ever to leverage the T&T sector’s potential for peace through sustainable development.
"It is crucial for the success of the global T&T sector that the challenges related to vaccine distribution and roll- out are addressed in an equitable and inclusive fashion. While further effort is required, public- private cooperation can provide a useful avenue to address this challenge."
Building favourable and inclusive labour, business and socioeconomic conditions
Over the course of the pandemic, the T&T sector has received substantial support in the form of debt financing, tax policies, assistance with business costs, public-sector investment, employment support, incentivization of tourism demand and easing of regulations. 47 In the future, continued investment in human capital and the creation of more favourable labour, business and socioeconomic conditions will be vital components in making the sector more inclusive, addressing ongoing challenges such as labour shortages and driving T&T growth and resilience.
Factors such as accessible and quality education and staff training, supportive hiring and firing practices, programmes to source skilled labour, flexible working arrangements and efforts to improve labour productivity can help equip T&T companies with a workforce that can improve operating efficiency, provide quality services, maintain flexibility in the face of evolving business needs and challenges and take advantage of the growing role of ICT tools. For example, according to the World Economic Forum’s The Future of Jobs Report 2020 , skills gaps in the local labour market were the number one barrier to adoption of new technologies in the transport and storage, and consumer sectors, the two sectors most closely tied to T&T. 48 Furthermore, according to the WTTC, factors such as facilitation of labour mobility, upskilling and reskilling and promotion of education are vital elements in addressing the current labour shortage. 49 Meanwhile, the past few years have shown how important policy stability, access to credit and creating more business- friendly regulatory and tax environments have been in supporting the T&T sector, especially SMEs that typically do not have the same resources and access to capital as larger firms. 50
The 2021 TTDI results partially reflect some efforts by policy-makers to support their economies, with the average Business Environment score climbing 1.7% since 2019. In particular, perceptions of the burden of government regulations and SME access to finance were areas that saw some of the largest improvements. The average Human Resource and Labour Market pillar also improved by 1.5% between 2019 and 2021, due to overall progress made in areas such as staff training. Nonetheless, less developed economies still score well below the TTDI average for most indicators for both pillars.
The pandemic has also highlighted how important an economy’s socioeconomic resilience is for the T&T sector. In general, the ability of an economy to support its population through social protections such as unemployment and maternity benefits, keep youth employed or in training, effectively uphold workers’ rights and support a diverse and inclusive workforce may potentially help strengthen employee productivity, expand the labour pool and make it more resilient to risks such as pandemics. 51 This is particularly true for the T&T sector because it provides income for a large number of youth, women, informal workers, the self-employed and small enterprises, who do not always have access to social or worker protections. Figure 8 shows that there is a relationship between socioeconomic resilience and conditions and labour productivity in T&T. Recent survey data also reinforces how important issues such as benefits and working conditions are for attracting talent and addressing the ongoing labour shortage in the sector. One poll of former US hospitality workers showed that more than half won’t return to their old jobs and over a third are not planning on returning to the industry as they seek higher pay, better working conditions and benefits, and more flexibility. 52
Figure 8: Correlation between socioeconomic resilience and conditions and tourism labour productivity

The 2021 TTDI results show that, across the board, socioeconomic resilience has tended to improve due to the expansion of social protection coverage and spending in line with global efforts to mitigate the impact of COVID-19. High-income economies do tend to score far higher on the Socioeconomic Resilience and Conditions pillar, putting them in a better position to deal with future challenges and maximize their workforce potential. Conversely, low- and lower-middle-income countries have far lower socioeconomic resilience due to more limited social protection, higher rates of youth not in education, employment or training (NEET), fewer workers rights and greater inequality of opportunity for all. As a result, the T&T sector in these economies may face more obstacles to recovery and may be more vulnerable to future risks.
While rising interest rates and debt levels represent a growing obstacle, government responses to the pandemic demonstrated their capacity to provide more comprehensive socioeconomic support, and the benefits of doing so, albeit during an unprecedented situation. While the pandemic has certainly disproportionately affected SMEs, entrepreneurs or more vulnerable populations, strengthening such mechanisms, especially in the T&T sector, could have compound benefits for the sector and economies as a whole.
The growing role of environmental sustainability
In the coming years, the success of T&T businesses and destinations will be increasingly tied to their ability to manage and operate under ever greater ecological and environmental threats. According to surveys conducted for the World Economic Forum’s Global Risks Report 2022 , environmental risks represent half of the top 10 global risks, with climate action failure, extreme weather and biodiversity role natural assets play in generating T&T demand and spend, these environmental risks represent a serious threat to long-term growth for the sector. Moreover, within this context, travellers increasingly value environmentally sustainable options. 54 df
The 2021 TTDI results indicate the extent of environmental sustainability threats and challenges. For instance, comparing the Natural Resources and Environmental Sustainability pillar scores helps to pinpoint where some of the greatest risks to nature-based tourism might lie. Out of the 30 economies that rank in the top quartile for natural resources, 17 score below the global average for environmental sustainability and eight rank in the bottom 25.
Figure 9 provides a regional view of the challenge. While most economies in the Americas and Asia- Pacific and almost half of those in sub-Saharan Africa score above average for natural resources, they commonly underperform in environmental sustainability, making it a critical problem for future T&T development. Environmental issues differ in these regions, but some examples include elevated climate-related risk (as measured by the Global Climate Risk Index), air and sea pollution, deforestation, poor wastewater treatment and inadequate preservation policies. In the Middle East and North Africa, common problems include water stress and air pollution. On the other hand, economies in the Europe and Eurasia region are world leaders in environmental sustainability, accounting for more than half of countries in the TTDI that score above average for this pillar. Combined with the fact that natural resources are not its greatest strength or dependency, the region and its tourism sector may be the better positioned to deal with future ecological risks.
Figure 9: Share of regional economies scoring above average for natural resources and environmental sustainability

Nonetheless, while there are some economies that have better environmental conditions, the challenge is widespread and is not easing. The difference in average score between the top and bottom quartiles for the Environmental Sustainability pillar is the second-lowest among the pillars. Moreover, performance for many indicators in this pillar has been mixed. For example, scores for deforestation continued to worsen. On the other hand, efforts to preserve the environment and T&T-generating natural assets got a boost from continued expansion in the share of protected territories and the number of environmental treaties signed.

A recent UNWTO and One Planet report reiterated the importance of a healthy environment for T&T competitiveness and development and recommended several actions to help the T&T sector produce a greener recovery. This included biodiversity protection actions such as putting tourism at the forefront of conservation efforts and ensuring that the value tourism provides for conservation efforts via monitoring mechanisms and investing in nature-based solutions is captured. Climate action efforts in T&T can be accelerated through the likes of monitoring and reporting emissions from tourism operations, accelerating decarbonization through the development of low-carbon transport options and greener infrastructure, and engaging in carbon removal via the restoration of carbon-density ecosystems and carbon-removal technologies. Finally, circular economy actions are recommended.
These include investing in transforming tourism value chains by reducing, reusing, repairing, refurbishing, remanufacturing, recycling and repurposing whenever possible; prioritizing sustainable food approaches such as local and organic procurement; creating sustainable menus and focusing on reducing food loss; and shifting towards a circularity of plastic in tourism. 55
At the World Economic Forum, efforts in this field are plentiful, and cover multistakeholder actions on decarbonizing transportation, accelerating action on plastics, ensuring the long-term, sustainable use of the ocean, and developing the circular economy. In particular, the Clean Skies for Tomorrow Coalition 56 is working with stakeholders in the aviation ecosystem, including buyers of corporate travel, to accelerate the production and use of sustainable aviation fuels, all while better distributing the green premium for these fuels. The Forum also hosts the Global Future Council on Sustainable Tourism, 57 a community of experts from academia, business, civil society and governments who are developing a set of principles for sustainable destinations to guide decision-making on rebuilding the sector in the wake of the pandemic. The Council is also researching customer behaviour changes that can incentivize the development and delivery of more sustainable travel products and services, articulating the value of investment in the blue and green economies in tourism, and providing guidance on the ambition of achieving net-zero emissions across the various verticals in the T&T sector.
Managing tourism demand and impact
Sustainable management of tourism demand that maximizes benefits for local communities, while also mitigating negative side effects such as overcrowding, will also become a vital component of T&T development as the sector recovers.
The TTCR 2019 discussed how long-term T&T growth was starting to put pressure on local infrastructure and housing, as well as degrading cultural and natural assets that attract visitors and fuelling uneven distribution of T&T benefits. This ultimately led to falling liveability standards for residents, local backlash against tourism and diminished visitor experience. 58 Although recent lockdowns and travel restrictions led to this sustainability challenge being discussed less, it is likely to become a more common topic as demand continues to recover. In many areas, the pandemic-fuelled travel demand push towards outdoor attractions, rural communities and secondary destinations has already revealed capacity constraints. For instance, the rise in nature travel had already led to more overcrowding at many national parks, with many US national parks monthly visitation number hitting all-time highs, leading to issue such as littering, wildlife disruption and traffic jams. 59 Visitors also show signs of wanting to reduce their footprint and improve the social impact on the destinations they visit, with just over half of global travellers in a recent survey indicating that they would be willing to switch their original destination for a lesser-known one if it led to a reduced footprint and greater community impact. 60
While issues such as overcrowding and other effects of T&T on communities are typically a local rather than national-level concern, the TTDI looks at the existence of, or risk related to, overcrowding and demand volatility, as well as the quality and impact of T&T via the T&T Demand Pressure and Impact pillar. In general, pillar results indicate that T&T Demand Pressure and Impact challenges affect economies of all levels of development. For instance, the difference in the average pillar score between low- and lower-middle-income and high-income economies covered by the index is just 0.8% and 2.5%, respectively.
High-income European countries tend to be some of the top TTDI performers and include rich cultural and non-leisure assets and quality transport and tourism infrastructure that allow for the absorption of large quantities of visitors. However, they still tend to score below average for the T&T Demand Pressure and Impact pillar due to factors such as shorter lengths of stay, higher seasonality and a very high level of concentration of interest in a small number of attractions, as shown by Tripadvisor page views and backed by at times unfavourable perceptions of the dispersions of tourism. Unsurprisingly, this region has often claimed headlines for tourism overcrowding. On the other hand, less-developed economies and those ranking lower on the TTDI tend to bring in fewer tourists, but still score below average for perception of tourism dispersion and town- and city-centre accessibility and crowding, an issue that may be partially explained by these economies’ typically below-average scores for transport infrastructure.
Figure 10: T&T Demand Pressure and Impact pillar component scores, 1–7 (best)

In summary, the relatively close distribution of T&T Demand Pressure and Impact pillar scores among economies of different incomes and tourist arrival levels highlights the fact that challenges such as overcrowding have less to do with visitor numbers and more to do with local conditions and policies.
Yet, as the sector rebuilds, there is an opportunity to use increasing domestic and nature-based T&T demand, consumers’ rising preference to manage their footprint and the need to address historical issues such as overcrowding by making investments and policies that help disperse T&T, thus making the sector more resilient. For one, proper care must be paid to developing transport, tourism, health and ICT infrastructure in rural, nature and secondary destinations. This can help funnel tourism and its benefits to more communities, make them more attractive destinations and increase their capacity to absorb more visitors. Within urban centres, improved road and public transport infrastructure and access to efficient, accessible, safe and affordable transport options can reduce the chances of overcrowding and lead to both greater liveability for residents and a better visitor experience (see Figure 11).
Figure 11: Correlation between public transport and quality of town and city centres

In general, TTDI 2021 results show an improvement in the Ground and Port Infrastructure pillar (+2.2%) since 2019. In particular, middle-income economies have experienced some of the strongest growth in areas such as perceptions of road quality and efficiency of train services. Nevertheless, as already alluded to, less-developed economies still have gaps in their infrastructure, ranging from lower road and rail density to a lack of access to efficient and quality public transport. Combined with lower marks for factors such as tourist and health infrastructure, these economies will face some of the greatest challenges in distributing tourism and its benefits throughout their communities. However, they also have the most to gain from overcoming these obstacles.
Aside from investment in infrastructure, policies are also a fundamental part of proper tourism demand management and dispersion. The above subsections of the key findings section explored how governments and destinations can institute policies to develop domestic and other forms of tourism. Moreover, there are specific efforts that can be made to manage T&T to prevent overcrowding and efficiently use a destination’s carrying capacity. For instance, the UNWTO has set out strategies and measures that can combat challenges such as these in cities. Some of these include the promotion of attractions and events that disperse visitors so they are not concentrated only in certain areas, time-based dynamic pricing, the creation of pedestrian-only zones, defining the carrying capacity of city areas, focusing on lower-impact visitor segments, ensuring local communities benefit from tourism, engaging with local stakeholders and monitoring the impact of tourism, including through the use of big data. 61
T&T stakeholders can also play a more active role in broader sustainable mobility efforts and trends that can help to reduce the sector’s environmental impact, manage demand and make destinations more attractive for visitors and residents. For example, the World Economic Forum’s Global New Mobility Coalition (GNMC) is a multistakeholder community for “accelerating the shift to a Shared, Electric and Autonomous Mobility (SEAM) system”. The synchronization of high-occupancy, electric and autonomous transport options can lead to better traffic flow, higher efficiency of road usage, more equitable mobility systems, better air quality, lower carbon emissions and improved grid resilience. More specifically, SEAM may reduce carbon emissions by 95%, improve mobility efficiency by 70% and decrease commuting costs by 40%. Given SEAM’s clear potential to create more sustainable destinations, a case can be made for T&T sector involvement this area. 62
The crucial role of digital technology
All of the aforementioned efforts to build back a better T&T sector will depend on effective leveraging of the growing role of digitalization in T&T.
More T&T services are being accessed by digital systems through online travel agencies (OTAs) and sharing economy platforms, direct online bookings, digital payment systems and mobile devices, and thus consumers tend to expect the greater convenience, increased options, reduced person- to-person contact and seamless experience that these systems provide. Furthermore, digitalization enables T&T businesses to gather consumer insights and preferences, optimize operations, cut transaction costs and automate processes. 63 Online platforms also enable T&T service providers, including SMEs, to reach beyond their local markets and connect with broader domestic and international markets. Due to the above- mentioned factors, it is not surprising that a positive relationship has been found between ICT readiness and international tourism receipts. 64 In the context of shifting demand dynamics, destinations with greater ICT readiness will be better positioned to diversify their markets and take advantage of trends such as the rising numbers of digital nomads and growth in nature-related travel. For instance, research shows a clear relationship between the ICT Readiness pillar and natural tourism online searches in economies with rich natural resources. 65
A recent report by the Asia Development Bank (ADB) and UNWTO outlines how the T&T sector can use big data and digitalization for better and more sustainable tourism management and recovery. Tourism-specific data coming from sources such as T&T operators and online platforms, and non-tourism-specific data coming from sources such as credit card transactions, mobility services and sensors can help T&T stakeholders track and manage the social, economic and environmental impacts of T&T, complement more traditional data-collection efforts, manage tourism flows and target preferred source markets, thereby helping to create smart destinations.

For instance, the Macao Government Tourism Office has worked with a major Chinese multinational technology company to “optimize visitors’ travel experiences before, during and after trips; obtain insights into travellers’ behaviour through in-depth analysis of big data; and monitor, divert and disperse visitor flows at tourist districts and congested areas”. The use of big data and various digital platforms and technology can also help seamless travel and act as health and security tools by enabling safety protocols, biosecurity technologies and digital health certificates, thereby boosting traveller confidence. However, the report also highlights the various barriers to greater use of big data and digitalization within the T&T sector. Some of these challenges include privacy concerns, data reliability, governance issues, disincentives for public-private collaboration, the digital divide, skills gaps and greater efforts to include SMEs. 66
Figure 12: ICT Readiness by economic income group, 2019–2021

Figure 12 helps to illustrate the digital divide among economic income groups. Developing economies typically lag when it comes to ICT infrastructure, internet connectivity and mobile network coverage, which hampers the use of digital platforms in financial services, transport and tourism activities. On the other hand, the ICT Readiness pillar is the most improved (+3.0%) since 2019 largely due to continued improvement in low- and middle-income economies. These results indicate that while high-income economies are best positioned to leverage digitalization and create smart destinations, developing economies are building capacity. In addition, as already mentioned, creating a more highly skilled labour force will be an essential element and challenge in maximizing the use of ICT tools in T&T.
The growing role of digitalization and, in particular, digital platforms, within the T&T space can also create other labour and socioeconomic challenges. Globally, the number of active digital labour platforms, which include ride-hailing taxi and delivery services, has grown from fewer than 200 in 2010 to at least 777 at the start of 2021. As stated, these platforms create new avenues for flexible employment for people, allow business to access wider markets and talent pools, improve productivity and provide convenience for customers. However, they could also lead to greater income and job insecurity. Commonly raised issues include less favourable working conditions, deficient social protection and employment benefits and a lack of access to fundamental rights of freedom of association and collective bargaining. 67 The growth in popularity of digital platforms offering short-term rentals has also led to concerns about residents’ access to housing at destinations where housing capacity is increasingly taken up by the T&T sector. 68 The concentration of market share in the hands of digital platforms may also lead to imbalances in the bargaining and pricing power of the various stakeholders, including workers and SMEs. 69
If proper efforts are made, from employee training and supporting SMEs’ use of ICT to fair and effective regulation of digital platforms and their impact on workers and destination communities, digitalization in T&T will become one of the driving forces in growing the sector’s role in inclusive, sustainable and resilient development. However, failing in these areas could also transform this key aspect of T&T operations into an increasingly acute barrier to future T&T growth.
4.4 Conclusion to the key findings
The COVID-19 pandemic and its impact have underscored the T&T sector’s vital role in global connectivity and development. In the coming years it will therefore be crucial for T&T stakeholders to devise strategies that make the sector more inclusive, sustainable and resilient.

As the TTDI 2021 results reveal, any such enterprise will require a comprehensive and holistic approach. Creating a better T&T economy is not just about improving infrastructure or offering favourable pricing. It also involves creating better health and hygiene conditions, ensuring natural resources are protected and that the workforce on which the sector depends has access to training and social protection. This necessitates the active participation and coordination of sector and non-sector business, employers and employees, government agencies ranging from tourism and health ministries to local authorities, environmental and conservation groups, and international organizations. Over the course of the pandemic, often uncoordinated travel restrictions and health protocols revealed the difficulty and necessity of such cooperation.
In the future, efforts will need to be made to devise common frameworks for defining and measuring T&T sustainability, including the creation of commonly accepted environment, social and governance metrics. The safe and ethical use of big data will prove fundamental to this cause. Moreover, in an increasingly complex and technology-enabled environment, it will be vital to ensure that developing economies, workers and SMEs are not left behind.
While these challenges may be difficult, the flexibility and adaptation the T&T sector has shown in the past few years also indicates that sector stakeholders are more than capable of rising to the occasion.
Coronavirus pandemic could cost global tourism $2 trillion this year

Facebook Twitter Print Email
The coronavirus pandemic will likely cost the global tourism sector $2 trillion in lost revenue in 2021, the UN's tourism body said Monday, calling the sector's recovery "fragile" and "slow."
According to the latest forecast by the United Nations World Tourism Organization ( UNWTO ), the same amount was lost in 2020, making it one of the sectors hit hardest by the health crisis.
📣📊The latest #UNWTOBarometer shows int'l tourist arrivals ⬆ by 58% in July-September compared to the same period of 2020. Traveler confidence + easing of entry restrictions have proven 🔑to cautiously #RestartTourism.More trends and forecast 🗞 https://t.co/NNcGTkkdYS pic.twitter.com/bXqlwD3ida World Tourism Organization UNWTO
Despite recent improvements, the report warned that demand for travel could be further affected by "uneven vaccination rates around the world and new COVID-19 strains which had prompted new travel restrictions in some countries.
In the past few days, the emergence of the Omicron variant has led dozens of countries to reinstate restrictions on arrivals, or to delay relaxation in COVID-19 travel and testing rules, leading to wide uncertainty for holiday season travellers worldwide.
Spikes in oil prices and the disruption of global supply chains have also had an effect. According to the latest UNWTO data, international tourist arrivals are expected to remain 70-75 per cent below 2019 levels in 2021, a similar decline as in 2020.
‘We cannot let our guard down’
Although a 58 per cent increase in tourist arrivals was registered in July-September of this year compared to the same period in 2020, this remained 64 per cent below 2019 levels, the UN body found.
In August and September, arrivals were at 63 per cent lower than 2019, which is the highest monthly result since the start of the coronavirus pandemic. Between January and September 2021, worldwide international tourist arrivals stood at 20 per cent lower, compared to 2020, a clear improvement from the 54 per cent drop, over the first six months of the year.
“Data for the third quarter of 2021 is encouraging,” UNWTO Secretary-General Zurab Pololikashvili said. “However, arrivals are still 76 per cent below pre-pandemic levels and results across the different global regions remain uneven.”
In light of the rising cases and the emergence of new variants, he added that “we cannot let our guard down and need to continue our efforts to ensure equal access to vaccinations, coordinate travel procedures, make use of digital vaccination certificates to facilitate mobility, and continue to support the sector.”
Uneven recovery
Despite the improvement seen in the third quarter of the year, the pace of recovery remains slow and uneven across world regions.
In some sub-regions, such as Southern and Mediterranean Europe, the Caribbean, North and Central America, arrivals actually rose above 2020 levels in the first nine months of 2021.
However, arrivals in Asia and the Pacific were down by as much as 95 per cent when compared with 2019, as many destinations remained closed to non-essential travel.
Africa and the Middle East recorded 74 per cent and 81 per cent drops respectively in the third quarter compared to 2019. Among the larger destinations, Croatia, Mexico and Turkey showed the strongest recovery in the period of July to September.
Caribbean rebound
The Caribbean had the highest results of any of the subregions defined by the UNWTO, with arrivals up 55 per cent compared to 2020.
International tourist arrivals "rebounded" during the summer season in the Northern Hemisphere thanks to increased travel confidence, rapid vaccination and the easing of entry restrictions in many nations.
In Europe, the EU Digital Covid Certificate has helped facilitate free movement within the European Union, the report added.
WORLD TRADE ORGANIZATION
Home | About WTO | News & events | Trade topics | WTO membership | Documents & resources | External relations
Contact us | Site map | A-Z | Search
español français
- research/analysis
- wto publications
- about the wto
ABOUT THE WTO
WTO Annual Report 2021
The 2021 Annual Report provides a comprehensive account of the WTO's activities in 2020 and early 2021. The Report opens with a message from WTO Director-General Ngozi Okonjo-Iweala and a brief overview of the past year. This is followed by in-depth accounts of the WTO's main areas of activity. Spotlights highlight the Director-General selection process, COVID-19 and world trade, and the WTO’s 25th anniversary. A short animation provides an overview of the Report.
- More about the WTO
- Previous WTO Annual Reports
Download by chapter:
Introduction.
- Message from Director-General Ngozi Okonjo-Iweala
A year in review
- Spotlight: Director-General selection process
Trade negotiations and discussions
Implementation and monitoring.
- Spotlight: COVID-19 and world trade
Dispute settlement activity in 2020
Supporting development and building trade capacity.
- Spotlight: 25th anniversary of the WTO
Secretariat and budget
How the wto is structured.
- WTO chairpersons

Download full report
Buy printed copy
Watch animation
Problems viewing this page? If so, please contact [email protected] giving details of the operating system and web browser you are using.

- Mobile Site
WTCF Releases Significant Research Report 'World Tourism Cities Development Report (2021)'
Publish Time:2022-09-03 20:44:56 Source: WTCF
【Introduction】:As an important research result of WTCF, the Report aims to present a more comprehensive and vivid picture of the development of the world's major tourism cities and tourism industry in 2021, and provide more experience sharing for the comprehensive recovery of the world tourism cities and tourism industry.
The World Conference on Tourism Cooperation and Development 2022, hosted by the World Tourism Cities Federation (WTCF), opened at the China National Convention Center in Beijing on 1 September. Du Yili, WTCF Expert and former Deputy Director-General of China National Tourism Administration, released World Tourism Cities Development Report (2021) (hereinafter referred to as the "Report") at the event. As an important research result of WTCF, the Report aims to present a more comprehensive and vivid picture of the development of the world's major tourism cities and tourism industry in 2021, and provide more experience sharing for the comprehensive recovery of the world tourism cities and tourism industry.
'")
Du Yili, WTCF Expert and former Deputy Director-General of China National Tourism Administration
As the world's first city-based international tourism organization, WTCF has issued the annual World Tourism Cities Development Report for eight consecutive years since its establishment in 2012, creating a brand of academic reports that promotes and guides the sustainable development of world tourism cities.
The Report is composed of three sections, namely "2021 Comprehensive Evaluation of World Tourism Cities Development", "World Tourism Cities Development (2021 Comprehensive Rankings)" and "World Tourism Cities Development (2021 Individual Rankings)". The "2021 Comprehensive Evaluation of World Tourism Cities Development" section systematically analyzes the huge impact of COVID-19 on world tourism and the features of tourism policies' development of world tourism cities amidst the epidemic. The Report points out that the current development of tourism cities features new trends. It notably finds that public governance capability has become a key driver of recovery, strengthened internal circulation has created a more stable and balanced market structure, digitalization has extended the frontiers of city tourism, and city tourism puts more emphasis on cooperation and common development.
The section on "World Tourism Cities Development (2021 Comprehensive Rankings)" has, on the basis of maintaining the continuity of the basic framework and data of previous development reports, studied the adjustment of the index system and focused on the observation and analysis objects of 100 sample cities in the world, such as Beijing, Tokyo, Sydney, Madrid, Cairo and Dubai, in order to make the evaluation indicators more truthfully reflect the dramatic changes in the tourism industry. According to the Report, the top 10 cities in terms of comprehensive rankings are Paris, London, Los Angeles, San Francisco, New York, Miami, Beijing, Sydney, Las Vegas and Chicago. By analyzing the comprehensive rankings of world tourism cities development, the Report summarizes the comprehensive index characteristics, such as the slow recovery of tourism industry, the new pattern of regional development, the new situation of city competition, the leapfrog development of smart tourism, and the visible weaknesses in tourism development.
The "World Tourism Cities Development (2021 Individual Rankings)" section presents the 2021 lists of city popularity, industry prosperity, city smartness, economic contribution and tourist satisfaction. Tokyo, Paris, Macao, Mexico City and Hong Kong ranked first in city popularity, industry prosperity, city smartness, economic contribution and tourist satisfaction respectively.
In addition, according to the comprehensive characteristics and analysis of the 2021 world tourism cities development, the Report also analyzes and summarizes seven solutions and suggestions to promote the comprehensive development of world tourism cities, including promoting epidemic prevention and control and tourism development, formulating policies for tourism recovery and development, focusing on product innovation and integrated development, advocating digital and smart tourism, improving public tourism services and the tourism security system, and implementing the concept of sustainable development.
'")
- World's Best Rally Crews to Attend Croatia Rally
- Top-class Exhibitions in Berlin in 2023
- Seychelles Holds First-ever Destination Workshops ...
- Fascinating River Tours: All in Hamburg!
- National Geographic Lists Longmen Grottoes in Luoy...
- Vienna: Mozart, Strauss and DJ Sounds
- Macao Most Satisfactory Destination for Mainland T...
- Carnival Legend Returns to Service Ahead of UK Dep...
- A Record Number of Passengers Passed Through Talli...
- Milan Bergamo Airport Welcomes Norwegian's New Sum...
- The Beautifully Restored and Enhanced Four Seasons...
- Riga Airport Profit in 2023 – 1.6 Millio...
- U-tour Collaborates with H Rewards and GNTB to Exp...
- Visit Belfast Unveils Ambitious 'New Horizons' Pla...
- Finnair Blossoms with Return to Nagoya

Strategic Partner

Beijing Municipality | Florence | Victoria | Torino | Sevilla | Chinese Friendly International | Innova Tax Free Group | World Travel & Tourism Council | World Tourism Organization | Pacific Asia Travel Association |
Beijing tourism development commission | un | wen wei po | via hansa | tui ag | the beijing news | taikang life insurance co. | skyscanner | sina.com |, shanghai spring international travel service | mastercard | kuoni | kempinski hotels | jtb | okura nikko hotel management co., ltd. | icbc | hong kong airlines | hanatour |, four seasons hotels and resorts | dfs | trip.com | costa crociere s.p.a. | club med | chinese national geography | china unionpay | china travel service | china southern airlines | china news service |, china international travel services | china daily | cyts | cctv | chengdu shuangliu international airport | carnival corporation & plc |, capital airports holding company | caissa | btg international travel & tours | beijing utour | beijing tourism group | beijing gongmei group | beijing capital international airport |, american tours international | american express | america asia travel center inc. | air china | abercrombie & kent | zurich | zhangjiajie | zagreb | yangzhou | xiamen | xi’an | wuhan | wellington | washington | wales | vienna |, veliko tarnovo | vancouver | valletta | toronto | tianjin | thessaloniki | tel aviv-yafo | taiyuan | sofia | athens | shanghai | seoul | sapp oro | sanya |, san francisco | rome | riga | rabat | qingdao | prague | pomorie | plovdiv | pen ang | pa ris-île de france | ottawa | nur-sultan | nicosia | nice | nanjing | mudanjiang | moscow | minsk | milan | marigot | macao | luoyang | los angeles | london | lisbon | kunming | kathmandu | jiaozuo | jakarta | houston | hong kong | helsinki | harbin | hangzhou | hamburg | gwangju | guangzhou | geneve | fez | edinburgh | dublin | dubai | dalian | copenhagen | colombo | chongqing | chengdu | casablanca | cairo | busan | buenos aires | budapest | brussels | boston | berlin | beijing | barcelona | bangkok | bandung | amsterdam | altay | almaty.
- Organizations
- WTCF Promotion Video
- Member List
- Institutional Members
- Sub-committees
- Media Reports
- Legal disclaimer
- Institutional News
- World Conference on Tourism Cooperation and Development
- WTCF World Conference on Tourism Cooperation and Development 2023
- WTCF World Conference on Tourism Cooperation and Development 2022
- WTCF Beijing Fragrant Hills Tourism Summit & World Conference on Tourism Cooperation and Development 2021
- WTCF Academic Achievement
- WTCF Reports
- Fragrant Hills Tourism Summit
- WTCF Changsha Fragrant Hills Tourism Summit 2023
- WTCF Beijing Fragrant Hills Tourism Summit 2021
- WTCF Helsinki Fragrant Hills Tourism Summit 2019
- WTCF Qingdao Fragrant Hills Tourism Summit 2018
- WTCF Los Angeles Fragrant Hills Tourism Summit 2017
- WTCF Chongqing Fragrant Hills Tourism Summit 2016
- WTCF Rabat & Fez Fragrant Hills Tourism Summit 2015
- WTCF Beijing Fragrant Hills Tourism Summit 2014
- WTCF Beijing Fragrant Hills Tourism Summit 2013
- WTCF Beijing Fragrant Hills Tourism Summit 2012
E-Mail Login | Contact Us | Careers | Legal disclaimer
世界旅游城市联合会版权所有 备案号:京ICP备19050424号-1
Our legal counselors: lawyer Song Yunfeng & lawyer He Wen, from Dacheng Law Offices
World Population Prospects 2022
- Download Center
- Data Portal
- Data Sources
- Graphs / Profiles
- Definition of Regions
- Glossary of Demographic Terms
- Methodology
- Definition of Projection Scenarios
- Frequently Asked Questions
- Publications
- World Urbanization Prospects
- Population Division

The 2022 Revision of World Population Prospects is the twenty-seventh edition of official United Nations population estimates and projections that have been prepared by the Population Division of the Department of Economic and Social Affairs of the United Nations Secretariat. It presents population estimates from 1950 to the present for 237 countries or areas, underpinned by analyses of historical demographic trends. This latest assessment considers the results of 1,758 national population censuses conducted between 1950 and 2022, as well as information from vital registration systems and from 2,890 nationally representative sample surveys The 2022 revision also presents population projections to the year 2100 that reflect a range of plausible outcomes at the global, regional and national levels.
The main results are presented in a series of Excel files displaying key demographic indicators for each UN development group, World Bank income group, geographic region, Sustainable Development Goals (SDGs) region, subregion and country or area for selected periods or dates within 1950-2100. An online database (Data Portal) provides access to a subset of key indicators and interactive data visualization, including an open API for programmatic access. For advanced users who need to use these data in a database form or statistical software, we recommend to use the CSV format for bulk download. Special Aggregates also provide additional groupings of countries. For the first time, the estimates and projections are presented in one-year intervals of age and time instead of the five-year intervals used previously. The various datasets disaggregated by age are available in two forms: by standard 5-year age groups and single ages.
Additional outputs, including results from the probabilistic projections, and more detailed metadata will be posted soon after the initial public release.

Disclaimer: This web site contains data tables, figures, maps, analyses and technical notes from the current revision of the World Population Prospects. These documents do not imply the expression of any opinion whatsoever on the part of the Secretariat of the United Nations concerning the legal status of any country, territory, city or area or of its authorities, or concerning the delimitation of its frontiers or boundaries.

Goal 2: Zero Hunger
Goal 2 is about creating a world free of hunger by 2030.The global issue of hunger and food insecurity has shown an alarming increase since 2015, a trend exacerbated by a combination of factors including the pandemic, conflict, climate change, and deepening inequalities.
By 2022, approximately 735 million people – or 9.2% of the world’s population – found themselves in a state of chronic hunger – a staggering rise compared to 2019. This data underscores the severity of the situation, revealing a growing crisis.
In addition, an estimated 2.4 billion people faced moderate to severe food insecurity in 2022. This classification signifies their lack of access to sufficient nourishment. This number escalated by an alarming 391 million people compared to 2019.
The persistent surge in hunger and food insecurity, fueled by a complex interplay of factors, demands immediate attention and coordinated global efforts to alleviate this critical humanitarian challenge.
Extreme hunger and malnutrition remains a barrier to sustainable development and creates a trap from which people cannot easily escape. Hunger and malnutrition mean less productive individuals, who are more prone to disease and thus often unable to earn more and improve their livelihoods.
2 billion people in the world do not have reg- ular access to safe, nutritious and sufficient food. In 2022, 148 million children had stunted growth and 45 million children under the age of 5 were affected by wasting.
How many people are hungry?
It is projected that more than 600 million people worldwide will be facing hunger in 2030, highlighting the immense challenge of achieving the zero hunger target.
People experiencing moderate food insecurity are typically unable to eat a healthy, balanced diet on a regular basis because of income or other resource constraints.
Why are there so many hungry people?
Shockingly, the world is back at hunger levels not seen since 2005, and food prices remain higher in more countries than in the period 2015–2019. Along with conflict, climate shocks, and rising cost of living, civil insecurity and declining food production have all contributed to food scarcity and high food prices.
Investment in the agriculture sector is critical for reducing hunger and poverty, improving food security, creating employment and building resilience to disasters and shocks.
Why should I care?
We all want our families to have enough food to eat what is safe and nutritious. A world with zero hunger can positively impact our economies, health, education, equality and social development.
It’s a key piece of building a better future for everyone. Additionally, with hunger limiting human development, we will not be able to achieve the other sustainable development goals such as education, health and gender equality.
How can we achieve Zero Hunger?
Food security requires a multi-dimensional approach – from social protection to safeguard safe and nutritious food especially for children to transforming food systems to achieve a more inclusive and sustainable world. There will need to be investments in rural and urban areas and in social protection so poor people have access to food and can improve their livelihoods.
What can we do to help?
You can make changes in your own life—at home, at work and in the community—by supporting local farmers or markets and making sustainable food choices, supporting good nutrition for all, and fighting food waste.
You can also use your power as a consumer and voter, demanding businesses and governments make the choices and changes that will make Zero Hunger a reality. Join the conversation, whether on social media platforms or in your local communities.

Facts and Figures
Goal 2 targets.
- Despite global efforts, in 2022, an estimated 45 million children under the age of 5 suffered from wasting, 148 million had stunted growth and 37 million were overweight. A fundamental shift in trajectory is needed to achieve the 2030 nutrition targets.
- To achieve zero hunger by 2030, urgent coordinated action and policy solutions are imperative to address entrenched inequalities, transform food systems, invest in sustainable agricultural practices, and reduce and mitigate the impact of conflict and the pandemic on global nutrition and food security.
Source: The Sustainable Development Goals Report 2023
2.1 By 2030, end hunger and ensure access by all people, in particular the poor and people in vulnerable situations, including infants, to safe, nutritious and sufficient food all year round.
2.2 By 2030, end all forms of malnutrition, including achieving, by 2025, the internationally agreed targets on stunting and wasting in children under 5 years of age, and address the nutritional needs of adolescent girls, pregnant and lactating women and older persons.
2.3 By 2030, double the agricultural productivity and incomes of small-scale food producers, in particular women, indigenous peoples, family farmers, pastoralists and fishers, including through secure and equal access to land, other productive resources and inputs, knowledge, financial services, markets and opportunities for value addition and non-farm employment.
2.4 By 2030, ensure sustainable food production systems and implement resilient agricultural practices that increase productivity and production, that help maintain ecosystems, that strengthen capacity for adaptation to climate change, extreme weather, drought, flooding and other disasters and that progressively improve land and soil quality.
2.5 By 2020, maintain the genetic diversity of seeds, cultivated plants and farmed and domesticated animals and their related wild species, including through soundly managed and diversified seed and plant banks at the national, regional and international levels, and promote access to and fair and equitable sharing of benefits arising from the utilization of genetic resources and associated traditional knowledge, as internationally agreed.
2.A Increase investment, including through enhanced international cooperation, in rural infrastructure, agricultural research and extension services, technology development and plant and livestock gene banks in order to enhance agricultural productive capacity in developing countries, in particular least developed countries.
2.B Correct and prevent trade restrictions and distortions in world agricultural markets, including through the parallel elimination of all forms of agricultural export subsidies and all export measures with equivalent effect, in accordance with the mandate of the Doha Development Round.
2.C Adopt measures to ensure the proper functioning of food commodity markets and their derivatives and facilitate timely access to market information, including on food reserves, in order to help limit extreme food price volatility.
International Fund for Agricultural Development
Food and Agriculture Organization
World Food Programme
UNICEF – Nutrition
Zero Hunger Challenge
Think.Eat.Save. Reduce your foodprint.
UNDP – Hunger
Fast Facts: No Hunger

Infographic: No Hunger

Related news

World Oceans Day event highlights immediate action to protect oceans
dpicampaigns 2024-06-07T08:00:00-04:00 07 Jun 2024 |
UN World Oceans Day, celebrated on Friday at UN Headquarters in New York, focused on “opening minds, igniting senses, and inspiring possibilities” to protect marine life worldwide.
Read Full Story on UN News
Media advisory | Rethinking Disability Inclusion: A Global Call to Action
Yinuo 2024-06-07T11:09:07-04:00 06 Jun 2024 |

Conference of States Parties to the Convention on the Rights of Persons with Disabilities
Rethinking Disability Inclusion: A Global Call to Action
Follow LIVE on UN Web TV
At a time when the world […]

World heading towards new temperature records, UN weather watchdog warns
dpicampaigns 2024-06-05T08:00:00-04:00 05 Jun 2024 |
At least one of the years between now and 2028 will very likely set a new temperature record, breaking through the crucial 1.5°C temperature limit, the UN weather agency, WMO, said on Wednesday.
Related videos
UN World Oceans Day, celebrated on Friday at UN Headquarters in New York, focused on “opening minds, igniting senses, and inspiring possibilities” to protect marine life worldwide. Read Full Story on UN News
Conference of States Parties to the Convention on the Rights of Persons with Disabilities Rethinking Disability Inclusion: A Global Call to Action Follow LIVE on UN Web TV At a time when the world is [...]
At least one of the years between now and 2028 will very likely set a new temperature record, breaking through the crucial 1.5°C temperature limit, the UN weather agency, WMO, said on Wednesday. Read Full [...]
Share this story, choose your platform!
Blog of the Textual Records Division at the National Archives
The Text Message
80 Years Later: Documenting the Loss and Honoring the Sacrifices of D-Day
Today’s post was written by Rachael Salyer, archivist in the Textual Reference Branch at the National Archives at College Park, MD.

June 6, 2024 marks the 80th anniversary of D-Day, the start of the Allied invasion of Normandy during World War II. Operation Neptune, the codename for the Normandy landings, included Allied assaults on five beaches: Utah, Omaha, Gold, Juno, and Sword. Of these, American forces were responsible for the invasions at Utah and Omaha. According to the Department of Defense D-Day Fact Sheet , approximately 73,000 American service members participated in these assaults. Utah Beach was assigned to the U.S. 1st Army, 7th Corps, which experienced the fewest losses with only 197 deaths. The U.S. 1st Army, 5th Corps was responsible for taking Omaha Beach, and they were supported by sea transport from the U.S. Navy. The Omaha Beach assaults resulted in 2,400 American casualties. The National World War II Museum Fact Sheet on the D-Day Invasion at Normandy – June 6, 1944 lists the total number of American service members who were killed, wounded, missing, or captured as 8,230. Those numbers continued to rise as the Allied invasion continued in the following weeks.

The National Archives and Records Administration (NARA) has custody of numerous Records Relating to D-Day planning, operations, and communications. NARA also holds records that document the losses of the Normandy invasion, as well as initial efforts to honor those sacrifices. Among these records are Weekly Burial Reports of the Army’s Graves Registration Service (GRS), which was under the control of the Office of the Quartermaster General. Many of these reports can be found in the series General Correspondence Relating to Organizations, 1939–1954 (entry NM-81 1894-A, NAID 650218) in Record Group 92: Records of the Office of the Quartermaster General. Although the complete series is not available online, many of the Weekly Burial Reports have been digitized and may be viewed in the National Archives Catalog. Records of burials in the European Theater of Operations (ETO) include records of established cemeteries in the United Kingdom, like Brookwood American Cemetery and Cambridge American Cemetery , as well as new, temporary cemeteries established in Europe after D-Day.

The Weekly Burial Reports that cover the Normandy invasion are part of the 1939-1945 section of Entry NM-81 1894-A. Within this section of the series, the records are arranged alphabetically by organization or location and then according to the War Department Decimal File System , which uses decimal 293 for “Funerals, burials, and reports” and decimal 314.6 for “Death and interment records.” The reports do not contain detailed information about individual burials, but they do typically list the service member’s name, service number, rank, organization, date of burial, and cemetery. They also include the names of service members from all branches of the Armed Forces.

The Weekly Burial Reports for St. Laurent Cemetery, which eventually became the Normandy American Cemetery , can also be found among these records. The Quartermaster General publication Final Disposition of World War II Dead, 1945-1951 notes that “[s]ince St. Laurent represented the first temporary American Cemetery established in Europe during World War II, it almost inevitably later became a permanent war memorial. Situated on a bluff overlooking that section of the Allied landing area called ‘Omaha Beach,’ St. Laurent Cemetery came into existence on 7 June 1944, just 24 hours after the first assault on D-Day. The initial burials consisted of Americans who had died on the beaches during the first day of combat. Most of the interments made in St. Laurent occurred during the first 2 or 3 weeks following D-Day, and amounted to over 3,800.”

Some of the service members who were interred in these cemeteries were later repatriated and reinterred in cemeteries in the U.S., and many were reinterred in permanent American military cemeteries in Europe under the direction of the American Battle Monuments Commission (AMBC) . Other digitized series documenting such reinterments include records like the Interment Control Forms, 1928 – 1962 (entry A1 2110-B, NAID 5833879 ), the Applications for Headstones, 1/1/1925 – 6/30/1970 (entry A1 1942-A, A1 2110-C, NAID 596118) in Record Group 92; and the Headstone Inscription and Interment Records for U.S. Military Cemeteries on Foreign Soil, 1942–1949 (entry A1 43, NAID 7408555) in Record Group 117: Records of the American Battle Monuments Commission. The Weekly Burial Reports, though, help tell the story of the immediate aftermath of D-Day as losses were just beginning to be counted.

For more information about the series General Correspondence Relating to Organizations, 1939–1954 (entry NM-81 1894-A, NAID 650218) in Record Group 92, please email the Textual Reference Branch at the National Archives in College Park, MD (Archives II) at [email protected] .
For additional NARA resources related to D-Day and World War II, please see:
- D-Day | National Archives
- World War II Records | National Archives
- World War II: D-Day, The Invasion of Normandy | Eisenhower Presidential Library
- FACT SHEET: Normandy Landings | whitehouse.gov
If you are researching the death of a specific service member, you may wish to request a copy of their Individual Deceased Personnel File (IDPF, also known as Mortuary or Casualty Files) . Some IDPFs (e.g., from NAID 297287480) have already been digitized and may be viewed online in the Catalog.
Finally, to learn more about other records in NARA’s custody that relate to military deaths in World War II, please see the finding aid Reference Information Paper (RIP) 82: Records Relating to Personal Participation in World War II: American Military Casualties and Burials .

This is the second in a series of blogs commemorating the 80th anniversary of the Allied invasions at Normandy.
*All photographs are from the file unit France – Normandy Invasion: Omaha and Utah Beaches in the series U.S. Army Signal Corps Photographs Of Military Activity During World War II and The Korean Conflict, 1941–1954 . Department of Defense. Department of the Army. Office of the Chief Signal Officer. Record Group 111: Records of the Office of the Chief Signal Officer. National Archives at College Park, College Park, MD.
**All document images are from the series General Correspondence Relating to Organizations, 1939–1954 (entry NM-81 1894-A) . Department of Defense. Department of the Army. Office of the Quartermaster General. Record Group 92: Records of the Office of the Quartermaster General. National Archives at College Park, College Park, MD.
Share this:
One thought on “ 80 years later: documenting the loss and honoring the sacrifices of d-day ”.
God bless our fallen veteran’s and the tough but necessary work of the Graves Registration Unit’s…thank you for conferring a fitting burial for our nation’s warriors!
Leave a Reply Cancel reply
Your email address will not be published. Required fields are marked *
Save my name, email, and website in this browser for the next time I comment.
UN Tourism | Bringing the world closer
Executive council 121 st session.
Barcelona, Spain, 10-11 June 2024
UNWTO Members Meet to Rethink Agenda for African Tourism
A tour of african gastronomy, #myafrica – sharing stories about your africa, latest news, seychelles draft tourism, seychelles tourism department charts a path to su..., when tourism meets handicrafts in madagascar, 1st tourism working group meeting (online) – g20 ..., un tourism youth photo contest "a journey through zimbabwe's gastronomy", first un tourism regional forum on gastronomy tourism for africa, regional webinar for africa | invest in women: accelerate progress, the 67th meeting of the un tourism regional commission for africa and 2nd un tourism regional conference on brand africa under the theme: "promoting africa to unlock tourism investments and the sector’s growth potential", africa news issue 23, africa news issue 22, africa news | volume 21. may 2022, africa news | volume 20. nov 2021.
IMAGES
VIDEO
COMMENTS
October - December. The final quarter of 2021 began with cautious optimism as UNWTO's Barometer showed signs of improvement in tourist arrival numbers during the summer season in the northern hemisphere. A new partnership with Netflix will bring the message of tourism as a driver of opportunity to a massive global audience, while in November, UNWTO was tourism's voice at COP26 and ...
Tourism Statistics. Get the latest and most up-to-date tourism statistics for all the countries and regions around the world. Data on inbound, domestic and outbound tourism is available, as well as on tourism industries, employment and complementary indicators. All statistical tables available are displayed and can be accessed individually ...
UNWTO's extended scenarios for 2021-2024 indicate that it could take between two-and-a-half and four years for international tourism to return to 2019 levels. The gradual rollout of a COVID-19 vaccine is expected to help restore consumer confidence, contribute to ease travel restrictions and slowly normalize travel during the year ahead.
International tourism up 4% in 2021 but still 72% below pre-pandemic levels Global tourism experienced a mild 4% upturn in 2021, with 15 million more international tourist arrivals (overnight visitors) than in 2020 but remained 72% below the levels of pre-pandemic year 2019 according to preliminary estimates. This follows a 73% plunge in international travel in 2020, the worst year on record ...
(local currencies, constant prices), World and Regions A-4 - International Tourist Arrivals by Destination (Top 50) A-6 - International Tourism Receipts in US$ (Top 50) A-7 - International Tourism Receipts in euro (Top 50) A-8 - International Tourism Expenditure in US$ (Top 50) A-9 - International Tourism Expenditure in euro (Top 50) A-10
29 June 2021 Economic Development. The impact of the COVID-19 pandemic on tourism could result in a more than $4 trillion loss to the global economy, UN trade and development body UNCTAD said on Wednesday in a report issued jointly with the UN World Tourism Organization ( UNWTO ). The estimate is based on losses caused by the pandemic's ...
World Tourism Barometer: September 2022 ... (+172%) in January-July 2022 compared to the same period of 2021. Numbers climbed from -64% in January 2022 (versus 2019) to -28% in July, the strongest month since the start of the pandemic. ... WORLD TOURISM ORGANIZATION Calle Poeta Joan Maragall 42 28020 Madrid, Spain info★unwto.org please ...
The Travel & Tourism Competitiveness Report (TTCR) 2021 is the latest edition of the 15-year-old TTCR series, a flagship publication of the World Economic Forum's Platform for Shaping the Future of Mobility.
29 November 2021 Economic Development. The coronavirus pandemic will likely cost the global tourism sector $2 trillion in lost revenue in 2021, the UN's tourism body said Monday, calling the sector's recovery "fragile" and "slow." According to the latest forecast by the United Nations World Tourism Organization ( UNWTO ), the same amount was ...
International travel largely on hold despite uptick in May 2021 International tourist arrivals (overnight visitors) dropped by 85% in January-May 2021 compared to the same period of pre-pandemic year 2019, or 65% over 2020, as travel restrictions remained high due to the coronavirus pandemic. This follows an unprecedented drop of 73% in 2020, the worst year on record for international tourism ...
The 2021 Annual Report provides a comprehensive account of the WTO's activities in 2020 and early 2021. The Report opens with a message from WTO Director-General Ngozi Okonjo-Iweala and a brief overview of the past year. This is followed by in-depth accounts of the WTO's main areas of activity. Spotlights highlight the Director-General selection process, COVID-19 and world trade, and the WTO ...
WTCF Releases Significant Research Report 'World Tourism Cities Development Report (2021)' Publish Time:2022-09-03 20:44:56 Source:WTCF 【Introduction】:As an important research result of WTCF, the Report aims to present a more comprehensive and vivid picture of the development of the world's major tourism cities and tourism industry in 2021, and provide more experience sharing for the ...
The 2022 Revision of World Population Prospects is the twenty-seventh edition of official United Nations population estimates and projections that have been prepared by the Population Division of the Department of Economic and Social Affairs of the United Nations Secretariat. It presents population estimates from 1950 to the present for 237 countries or areas, underpinned by analyses of ...
International Tourism Highlights, 2020 Edition. Published: January 2021 Pages: 23. eISBN: 978-92-844-2245-6 | ISBN: 978-92-844-2244-9. Abstract: 2019 was another year of strong growth, though international arrivals grew below the exceptional rates seen in 2017 (+7%) and 2018 (+6%). Demand was somewhat weaker for travel to advanced economy ...
Goal 2 is about creating a world free of hunger by 2030.The global issue of hunger and food insecurity has shown an alarming increase since 2015, a trend exacerbated by a combination of factors ...
World Tourism Organization ( UNWTO ) Tel.: ( +34 ) 915 67 81 00 Calle del Poeta Joan Maragall, 42 Fax: ( +34 ) 915 71 37 33 28020 Madrid Website: www.unwto.org
The reports do not contain detailed information about individual burials, but they do typically list the service member's name, service number, rank, organization, date of burial, and cemetery. They also include the names of service members from all branches of the Armed Forces. Report No. 92_ July 02, 1944, page 9 (NAID 650218)
The latest Annual One Planet network report to the High-Level Political Forum (HLPF) of the United Nations Economic and Social Council (ECOSOC) was released in April 2020 and it is based on the Sustainable Tourism Programme's Progress Report 2019.. The reports to the HLPF provide yearly updates on the collective progress made by the members of the six programmes in the One Planet network.
Keywords: financial report 2021, financial impact, international events, financial statements, strategic objectives, ... World Tourism Organization (2023), UNWTO Financial Report and Audited Financial Statements for theYear Ended 31 December 2021, UNWTO, Madrid, DOI: ...
The 67TH Meeting of the UN Tourism Regional Commission for Africa and 2nd UN Tourism Regional Conference on Brand Africa under the theme: "Promoting Africa to unlock tourism investments and the sector's growth potential"