How-To Geek
How to turn on the develop menu in safari on mac.

Your changes have been saved
Email is sent
Email has already been sent
Please verify your email address.
You’ve reached your account maximum for followed topics.

Quick Links
How to enable the develop menu in safari on mac, how to view page source in safari on mac.
When you right-click on any web page in Safari on Mac, it doesn't reveal the Show Page Source and Inspect Element buttons. To see these, you need to enable the Develop menu---we'll show you how to do that.
Once you've enabled the Develop menu, right-clicking a blank space on any website will reveal the Inspect Element and Show Page Source buttons. These allow you to take a look at the source code of any website, which is useful for things like downloading images from websites and debugging code or finding out what it looks like behind any site (for website designers).
You can easily turn on the Develop menu in Safari by following a couple of steps. Open Safari on your Mac and click the "Safari" button in the menu bar.
Next, select "Preferences." Alternatively, you can use the keyboard shortcut Command+, (comma). This will also open up Safari preferences.
Go to the "Advanced" tab.
Check the box for "Show Develop Menu in Menu Bar."
Now the Develop menu will appear between Bookmarks and Window at the top.
Apart from being able to view the page source, this will allow you to access developer-focused features, such as disabling JavaScript on any website.
Once you've enabled the Develop menu, there are a couple of ways to view the page source in Safari.
Open any website in Safari and right-click the blank space on the page. Now, select "Show Page Source." You can also get to this menu by using the keyboard shortcut Option+Command+u.
If you're looking for images or other media elements from any web page, Safari makes it easy to find these. In the left-hand pane, you will see various folders such as Images, Fonts, etc. Click the "Images" folder to quickly find the photos that you need.
After selecting an image, you can view its details easily by opening up the details sidebar. The button to open this is located at the top-right of the console, just below the gear icon. You can also open this with the shortcut Option+Command+0.
Click "Resource" at the top of the details sidebar to view details, such as the size of the image and its full URL.
You can change the position of the page source console easily, too. There are two buttons at the top-left of this console, right next to the X button. Click the rectangle icon to move the console to a different side within the browser window.
If you'd like to open the page source console in a separate window, you can click the two-rectangles icon. This will detach the console and open it in a separate window.
To check out the code for any specific element on the page, you can right-click that element and select "Inspect Element." This will take you directly to the code for the element that you selected.
Whenever you're done looking at the code, click the X button to close the page source console and return to browsing on Safari. You can also check out how to view a website's page source in Google Chrome here.
Related: How to View the HTML Source in Google Chrome
- Web Browsers
How To Get Developer Tools In Safari

- Software & Applications
- Browsers & Extensions
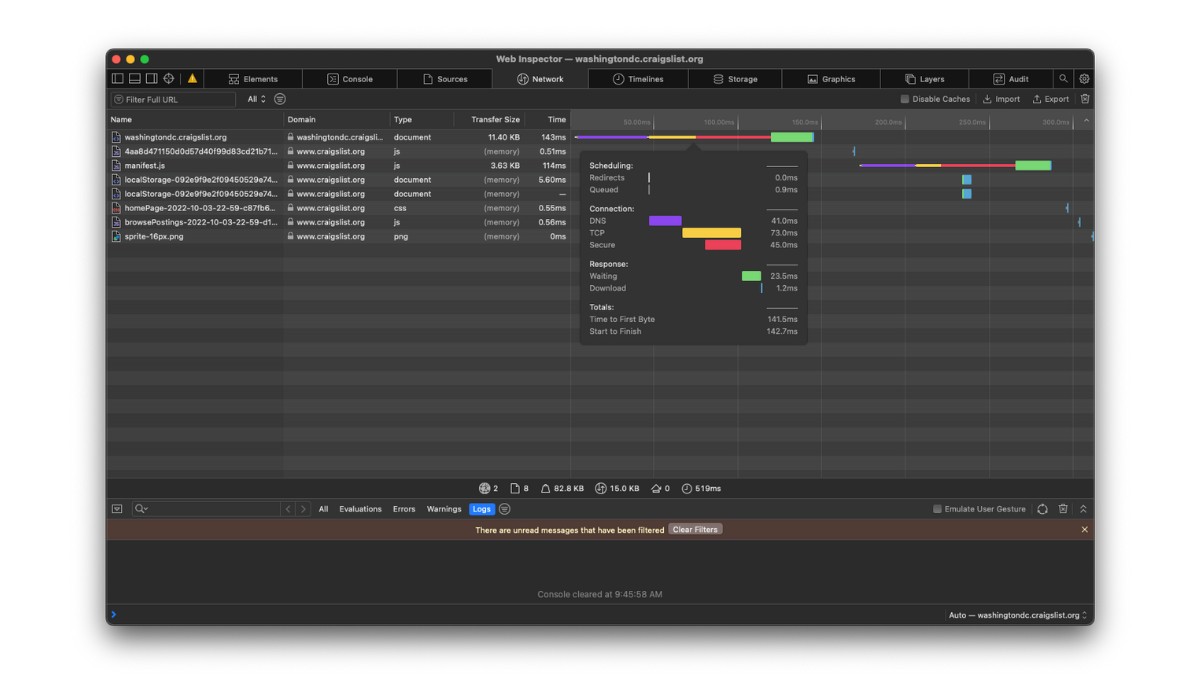
Introduction
Safari, the sleek and innovative web browser developed by Apple, is known for its user-friendly interface and seamless integration with Apple devices. While Safari offers a smooth browsing experience for users, it also provides powerful tools for web developers to create and optimize websites and web applications. One of the key features that sets Safari apart is its built-in Developer Tools, which offer a comprehensive set of resources for web development and debugging.
Whether you are a seasoned web developer or just starting out, having access to Safari's Developer Tools can significantly enhance your workflow and productivity. These tools enable you to inspect and modify web page elements, debug JavaScript, analyze network activity, and optimize website performance, among other capabilities. By leveraging Safari's Developer Tools, you can gain valuable insights into the structure and behavior of web pages, identify and troubleshoot issues, and fine-tune the performance of your web projects.
In this article, we will delve into the process of enabling and utilizing Safari's Developer Tools for web development. We will explore the various features and functionalities offered by these tools, providing practical insights and tips for leveraging them effectively. Whether you are a web developer, designer, or simply curious about the inner workings of websites, this guide will equip you with the knowledge and skills to harness the full potential of Safari's Developer Tools.
Let's embark on a journey to uncover the hidden gems of Safari's Developer Tools and unlock the power of web development within the confines of this innovative browser . Whether you're seeking to enhance your web development skills or gain a deeper understanding of web technologies, Safari's Developer Tools are your gateway to a world of possibilities. So, without further ado, let's dive into the realm of web development with Safari as our trusted companion.
Enabling Developer Tools in Safari
Enabling Safari's Developer Tools is a straightforward process that unlocks a treasure trove of functionalities for web development. Whether you're a seasoned developer or a curious enthusiast, accessing these tools can significantly enhance your web development experience within the Safari browser .
To enable Developer Tools in Safari, follow these simple steps:
Open Safari Preferences : Launch Safari and navigate to the "Safari" menu located in the top-left corner of the screen. From the drop-down menu, select "Preferences."
Access Advanced Settings : In the Preferences window, click on the "Advanced" tab. This will reveal a set of advanced settings for Safari.
Enable Develop Menu : Within the Advanced tab, locate the option labeled "Show Develop menu in menu bar" and ensure that it is checked. This action activates the Develop menu, which houses a plethora of web development tools and features.
Verify the Development Menu : After enabling the Develop menu, you should see it appear in the menu bar at the top of the screen, alongside other Safari menu options.
Once you have completed these steps, Safari's Developer Tools will be readily accessible, empowering you to delve into the intricacies of web development and gain valuable insights into the structure and behavior of web pages.
By enabling Developer Tools in Safari, you gain access to a suite of powerful resources that can elevate your web development capabilities. From inspecting and modifying web page elements to analyzing network activity and optimizing website performance, Safari's Developer Tools provide a comprehensive toolkit for enhancing your web projects.
With Developer Tools at your fingertips, you are poised to embark on an enriching journey through the realms of web development, armed with the tools and insights needed to create, optimize, and fine-tune captivating web experiences within the Safari browser.
Using Developer Tools for Web Development
Safari's Developer Tools offer a robust set of features and functionalities that empower web developers to streamline their workflows, troubleshoot issues, and optimize web projects. By leveraging these tools, developers can gain valuable insights into the inner workings of web pages and applications, ultimately enhancing the user experience and performance of their creations.
Inspecting and Modifying Web Page Elements
One of the fundamental capabilities of Safari's Developer Tools is the ability to inspect and modify web page elements in real time. By right-clicking on any element within a web page and selecting "Inspect Element," developers can access a detailed view of the HTML and CSS properties associated with that element. This feature is invaluable for understanding the structure and styling of web pages, allowing developers to make on-the-fly adjustments and see the immediate impact on the page layout.
Debugging JavaScript and Analyzing Console Output
Safari's Developer Tools include a robust JavaScript debugger, enabling developers to identify and resolve issues within their JavaScript code. By setting breakpoints, stepping through code, and examining variable values, developers can pinpoint and troubleshoot errors, ultimately improving the functionality and reliability of their web applications. Additionally, the console within Developer Tools provides a space for logging messages, errors, and warnings, offering valuable insights into the runtime behavior of JavaScript code.
Network Analysis and Performance Testing
Another powerful aspect of Safari's Developer Tools is the network panel, which allows developers to analyze network activity and optimize the performance of web pages. By monitoring network requests, loading times, and resource sizes, developers can identify opportunities for optimization, such as minimizing file sizes, leveraging caching strategies, and reducing unnecessary network requests. This capability is instrumental in creating fast and efficient web experiences for users across various devices and network conditions.
Modifying and Testing CSS in Real Time
Safari's Developer Tools provide a seamless environment for modifying and testing CSS styles directly within the browser. Developers can experiment with different styles, colors, and layouts, observing the immediate effects on web page elements. This real-time feedback accelerates the design and development process, allowing developers to fine-tune the visual presentation of their websites with precision and agility.
Leveraging Additional Tools and Resources
In addition to the aforementioned features, Safari's Developer Tools offer a wide array of resources, including the Elements panel for inspecting and editing the DOM, the Application panel for managing web storage and service workers, and the Security panel for identifying potential security vulnerabilities within web applications. These tools collectively provide a comprehensive toolkit for web developers, empowering them to create secure, performant, and visually compelling web experiences.
By harnessing the power of Safari's Developer Tools, web developers can elevate their skills, optimize their workflows, and deliver exceptional web experiences to users. Whether you are fine-tuning the layout of a responsive website, debugging complex JavaScript interactions, or optimizing the performance of a web application, Safari's Developer Tools are your indispensable companions in the journey of web development.
Inspecting and Debugging Web Pages
Inspecting and debugging web pages is a fundamental aspect of web development, and Safari's Developer Tools provide a robust set of features for this purpose. When it comes to understanding the structure and behavior of web pages, as well as identifying and resolving issues, the inspection and debugging capabilities within Safari's Developer Tools are indispensable.
Inspecting Web Page Elements
The ability to inspect web page elements is a cornerstone of Safari's Developer Tools. By right-clicking on any element within a web page and selecting "Inspect Element," developers can access a detailed view of the HTML and CSS properties associated with that element. This feature provides a comprehensive breakdown of the selected element, including its position, dimensions, styling, and any associated event listeners. This level of insight allows developers to gain a deep understanding of the composition and layout of web page elements, facilitating precise modifications and optimizations.
Modifying Web Page Elements in Real Time
In addition to inspecting web page elements, Safari's Developer Tools enable developers to modify elements in real time. By directly editing the HTML and CSS properties of elements within the Elements panel, developers can experiment with different styles, content, and layouts, observing the immediate impact on the web page. This real-time editing capability is invaluable for fine-tuning the visual presentation of web pages and rapidly iterating on design and layout changes.
Safari's Developer Tools include a powerful JavaScript debugger, which allows developers to identify and resolve issues within their JavaScript code. By setting breakpoints, stepping through code, and examining variable values, developers can pinpoint and troubleshoot errors, ultimately improving the functionality and reliability of their web applications. Additionally, the console within Developer Tools provides a space for logging messages, errors, and warnings, offering valuable insights into the runtime behavior of JavaScript code. This feature is instrumental in diagnosing and addressing JavaScript-related issues, ensuring the smooth execution of interactive and dynamic web elements.
In essence, Safari's Developer Tools provide a comprehensive suite of capabilities for inspecting and debugging web pages. From gaining insights into the structure and styling of web page elements to identifying and resolving JavaScript-related issues, these tools empower developers to create, optimize, and fine-tune web experiences with precision and efficiency. By leveraging the inspection and debugging features within Safari's Developer Tools, developers can elevate their skills, streamline their workflows, and deliver exceptional web experiences to users.
Modifying and Testing CSS and JavaScript
Modifying and testing CSS and JavaScript is a crucial aspect of web development, and Safari's Developer Tools offer a seamless environment for making real-time adjustments and testing code changes. Whether you're refining the visual presentation of a website or fine-tuning the functionality of interactive elements, Safari's Developer Tools provide a comprehensive toolkit for working with CSS and JavaScript.
Real-time CSS Modifications
Safari's Developer Tools allow developers to modify CSS styles directly within the browser, providing immediate feedback on the visual appearance of web page elements. By accessing the Styles panel, developers can experiment with different styles, colors, and layouts, observing the instant effects on the web page. This real-time editing capability accelerates the design and development process, enabling developers to iterate on visual enhancements with agility and precision.
Testing JavaScript Code
In addition to CSS modifications, Safari's Developer Tools facilitate the testing and debugging of JavaScript code. The JavaScript debugger within Developer Tools empowers developers to set breakpoints, step through code, and inspect variable values, facilitating the identification and resolution of JavaScript-related issues. By leveraging the debugging capabilities, developers can ensure the reliability and functionality of interactive elements, such as dynamic user interfaces and client-side interactions.
Performance Optimization
Furthermore, Safari's Developer Tools provide insights into the performance of CSS and JavaScript code. Developers can analyze the impact of CSS styles and JavaScript functions on web page loading times and responsiveness, identifying opportunities for optimization. By monitoring the execution of CSS and JavaScript, developers can fine-tune code to enhance the overall performance and user experience of web applications.
In summary, Safari's Developer Tools offer a comprehensive suite of features for modifying and testing CSS and JavaScript. From real-time CSS adjustments to JavaScript debugging and performance optimization, these tools empower developers to create visually compelling and functionally robust web experiences. By harnessing the capabilities within Safari's Developer Tools, developers can refine the presentation and behavior of web pages with precision, ensuring an exceptional user experience across various devices and platforms.
Network analysis and performance testing are critical components of web development, and Safari's Developer Tools provide a robust set of features for evaluating the network activity and optimizing the performance of web pages and applications.
Monitoring Network Activity
Safari's Developer Tools offer a comprehensive Network panel, which allows developers to monitor and analyze the network activity associated with a web page. This includes tracking network requests, such as HTTP requests for resources like HTML, CSS, JavaScript, images, and other assets. By examining the network waterfall, developers can gain insights into the timing and sequence of network requests, identifying potential bottlenecks and optimizing the loading process.
Resource Size and Loading Times
The Network panel within Safari's Developer Tools provides detailed information about the size and loading times of individual resources. Developers can assess the impact of resource sizes on web page performance, identifying opportunities to optimize assets for faster loading. By analyzing the loading times of resources, developers can prioritize critical content and streamline the delivery of essential assets, ultimately enhancing the overall user experience.
Safari's Developer Tools empower developers to optimize the performance of web pages by identifying and addressing potential performance bottlenecks. By leveraging the insights from the Network panel, developers can implement strategies to minimize file sizes, leverage browser caching, and reduce unnecessary network requests. Additionally, developers can assess the efficiency of third-party integrations and external resources, ensuring that web pages load quickly and responsively across various devices and network conditions.
Network Throttling
One of the standout features of Safari's Developer Tools is the ability to simulate different network conditions using network throttling. Developers can emulate various network environments, such as 3G , 4G, or slower connections, to assess the performance of web pages under different bandwidth constraints. This capability enables developers to optimize web pages for a wide range of network conditions, ensuring a consistent and reliable user experience for diverse audiences.
In essence, Safari's Developer Tools provide a comprehensive suite of capabilities for network analysis and performance testing. By monitoring network activity, assessing resource sizes and loading times, optimizing web page performance, and simulating network conditions, developers can create fast, efficient, and responsive web experiences. Leveraging the insights and tools within Safari's Developer Tools, developers can fine-tune the performance of web pages, ultimately delivering exceptional user experiences in the ever-evolving landscape of the web.
In conclusion, Safari's Developer Tools serve as a gateway to the intricate world of web development, offering a rich array of features and functionalities that empower developers to create, optimize, and fine-tune web experiences with precision and efficiency. By enabling and leveraging these tools, developers gain valuable insights into the structure, behavior, and performance of web pages, ultimately enhancing the user experience and functionality of their web projects.
From inspecting and modifying web page elements to debugging JavaScript, analyzing network activity, and optimizing performance, Safari's Developer Tools provide a comprehensive toolkit for addressing the diverse challenges of web development. The seamless integration of real-time editing, debugging, and performance analysis within the browser environment streamlines the development process, allowing developers to iterate on design and functionality with agility and precision.
Furthermore, the ability to simulate network conditions and assess the impact of resource sizes on web page performance equips developers with the tools needed to create fast, efficient, and responsive web experiences across various devices and network environments. This capability is instrumental in ensuring a consistent and reliable user experience, regardless of the user's location or network conditions.
By harnessing the power of Safari's Developer Tools, developers can elevate their skills, optimize their workflows, and deliver exceptional web experiences to users. Whether it's refining the visual presentation of a website, debugging complex JavaScript interactions, or optimizing the performance of a web application, Safari's Developer Tools are indispensable companions in the journey of web development.
In essence, Safari's Developer Tools not only provide a window into the inner workings of web pages but also empower developers to craft immersive, performant, and visually compelling web experiences. As the web continues to evolve, Safari's Developer Tools stand as a testament to Apple's commitment to providing developers with the resources and capabilities needed to thrive in the dynamic landscape of web development.
In the ever-expanding digital ecosystem, Safari's Developer Tools remain a steadfast ally for developers, offering a robust platform for innovation, creativity, and excellence in web development. Whether you're a seasoned developer or an aspiring enthusiast, Safari's Developer Tools invite you to embark on a journey of discovery and mastery, shaping the future of the web one line of code at a time.
Leave a Reply Cancel reply
Your email address will not be published. Required fields are marked *
Save my name, email, and website in this browser for the next time I comment.
- Crowdfunding
- Cryptocurrency
- Digital Banking
- Digital Payments
- Investments
- Console Gaming
- Mobile Gaming
- VR/AR Gaming
- Gadget Usage
- Gaming Tips
- Online Safety
- Software Tutorials
- Tech Setup & Troubleshooting
- Buyer’s Guides
- Comparative Analysis
- Gadget Reviews
- Service Reviews
- Software Reviews
- Mobile Devices
- PCs & Laptops
- Smart Home Gadgets
- Content Creation Tools
- Digital Photography
- Video & Music Streaming
- Online Security
- Online Services
- Web Hosting
- WiFi & Ethernet
- Browsers & Extensions
- Communication Platforms
- Operating Systems
- Productivity Tools
- AI & Machine Learning
- Cybersecurity
- Emerging Tech
- IoT & Smart Devices
- Virtual & Augmented Reality
- Latest News
- AI Developments
- Fintech Updates
- Gaming News
- New Product Launches
- 12 Best Free AI Image Sharpeners in 2024 WebPCMobile
Sanjuksha Nirgude Soaring High with Robotics
Related post, unveiling the secrets of sls printing and its role in robotics, unleashing efficiency: the role of robotic process automation in industry 4.0, advancing cybersecurity: the integration of robotics with emerging sms phishing alert tools – innovations, challenges, and future perspectives, robotics redefining long-term investment horizons, bridging software development and robotics for enhanced automation, the role of robotics in cnc machining for large part production, related posts.

How To Inspect On IPhone Safari

How To Test Website On Safari On Windows

How To Enable Inspect In Safari
How To Open Developer Tools On Safari

How To Install Safari On Apple TV 4
How To Get Safari Back To Normal

How To Download Video On Safari

How To Inspect On Safari IPhone
Recent stories.

12 Best Free AI Image Sharpeners in 2024 (Web/PC/Mobile)

OpenStack Backup and Recovery Software

Apple Wallet Availability in the PocketGuard App: Sync your Apple Card, Apple Cash, and Savings from Apple Card Accounts

5 Ways to Improve IT Automation

What is Building Information Modelling?

How to Use Email Blasts Marketing To Take Control of Your Market

Learn To Convert Scanned Documents Into Editable Text With OCR

- Privacy Overview
- Strictly Necessary Cookies
This website uses cookies so that we can provide you with the best user experience possible. Cookie information is stored in your browser and performs functions such as recognising you when you return to our website and helping our team to understand which sections of the website you find most interesting and useful.
Strictly Necessary Cookie should be enabled at all times so that we can save your preferences for cookie settings.
If you disable this cookie, we will not be able to save your preferences. This means that every time you visit this website you will need to enable or disable cookies again.
- Skip to main content
- Skip to search
- Skip to select language
- Sign up for free
- Português (do Brasil)
What are browser developer tools?
Every modern web browser includes a powerful suite of developer tools. These tools do a range of things, from inspecting currently-loaded HTML, CSS and JavaScript to showing which assets the page has requested and how long they took to load. This article explains how to use the basic functions of your browser's devtools.
Note: Before you run through the examples below, open the Beginner's example site that we built during the Getting started with the Web article series. You should have this open as you follow the steps below.
How to open the devtools in your browser
The devtools live inside your browser in a subwindow that looks roughly like this, depending on what browser you are using:
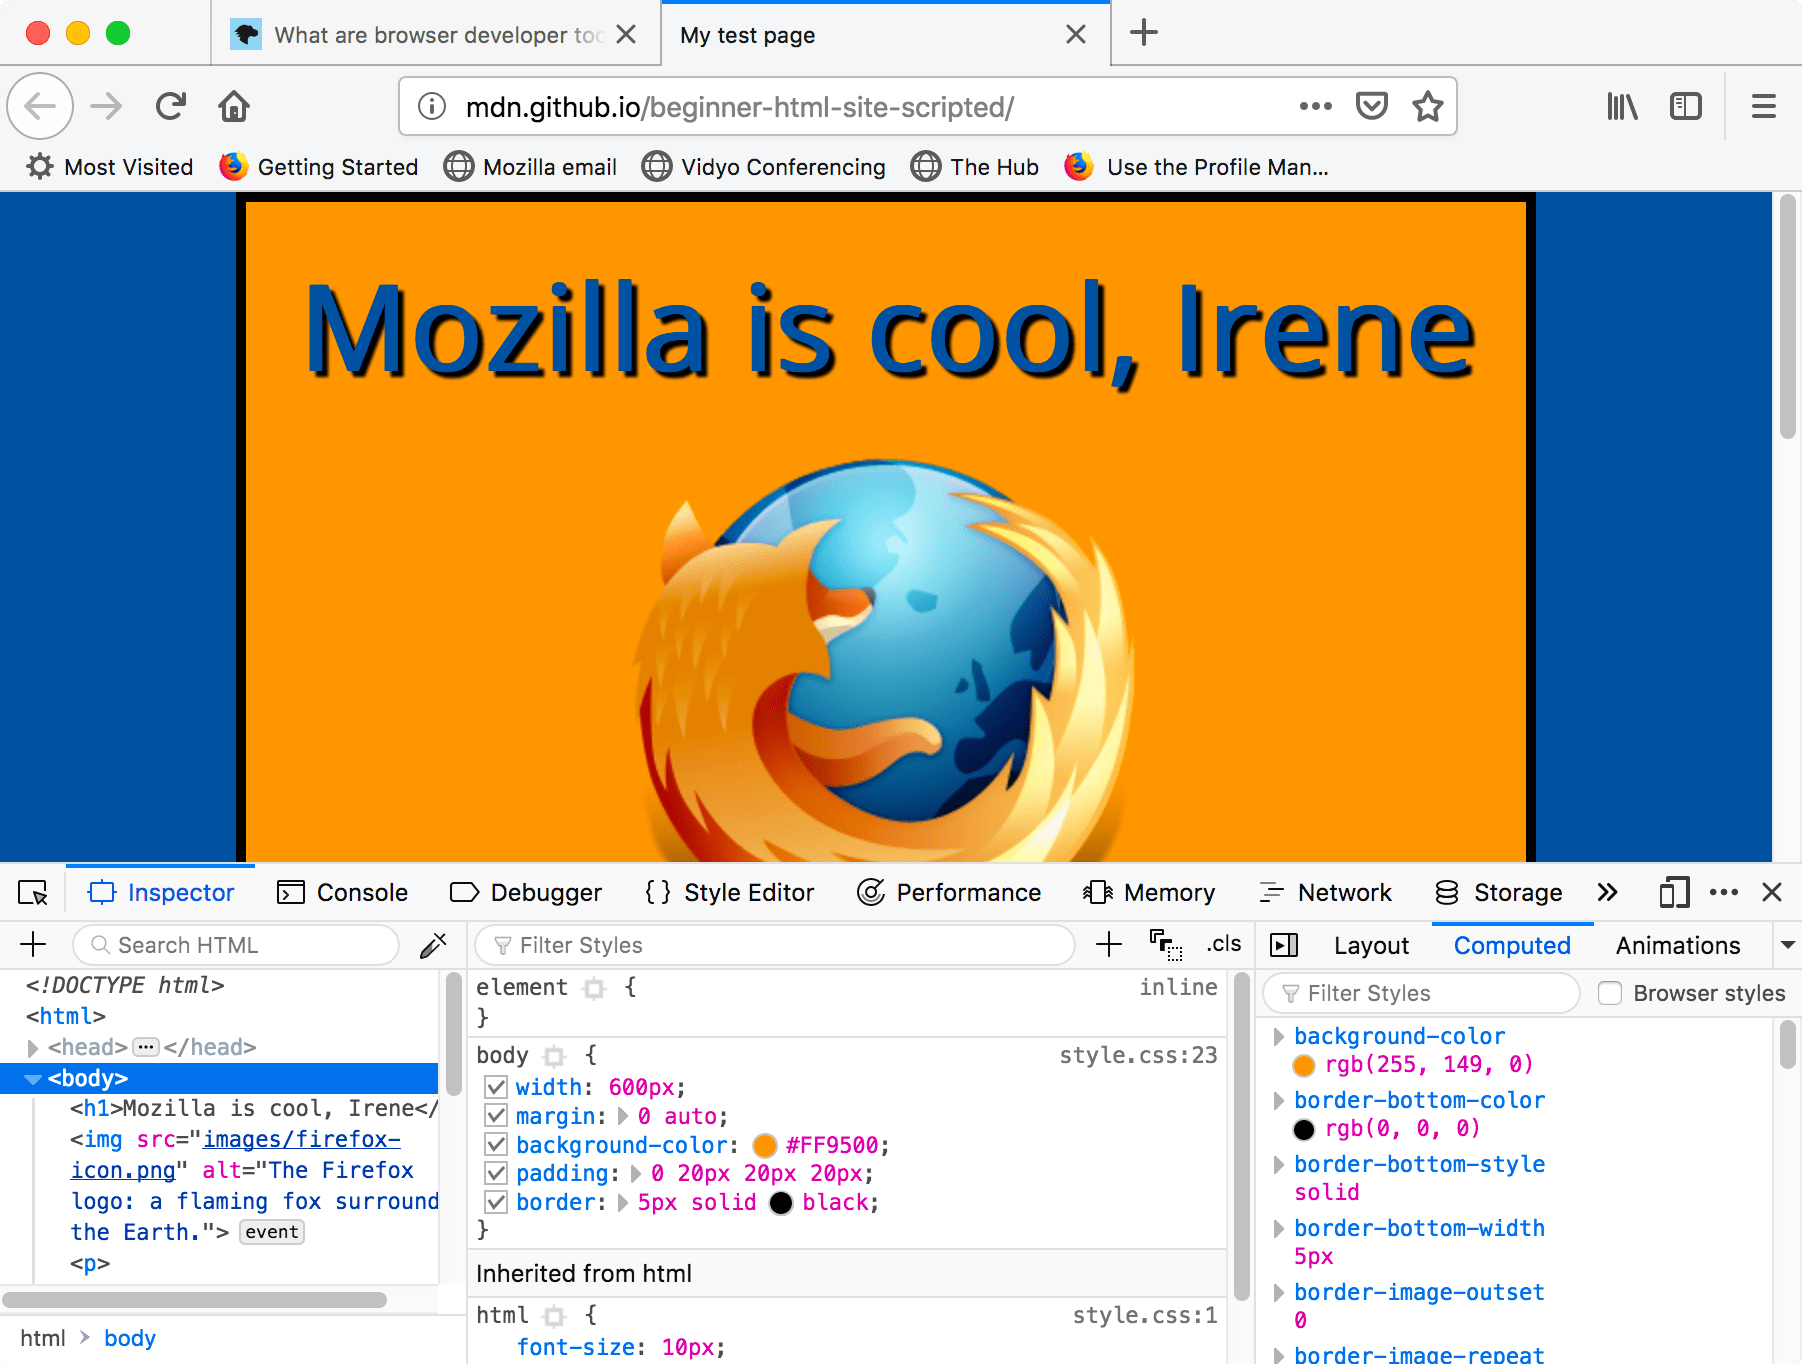
How do you pull it up? Three ways:
- Windows: Ctrl + Shift + I or F12
- macOS: ⌘ + ⌥ + I
- Chrome: More tools ➤ Developer tools
- Safari: Develop ➤ Show Web Inspector. If you can't see the Develop menu, go to Safari ➤ Preferences ➤ Advanced , and check the Show Develop menu in menu bar checkbox.
- Opera : Developer ➤ Developer tools
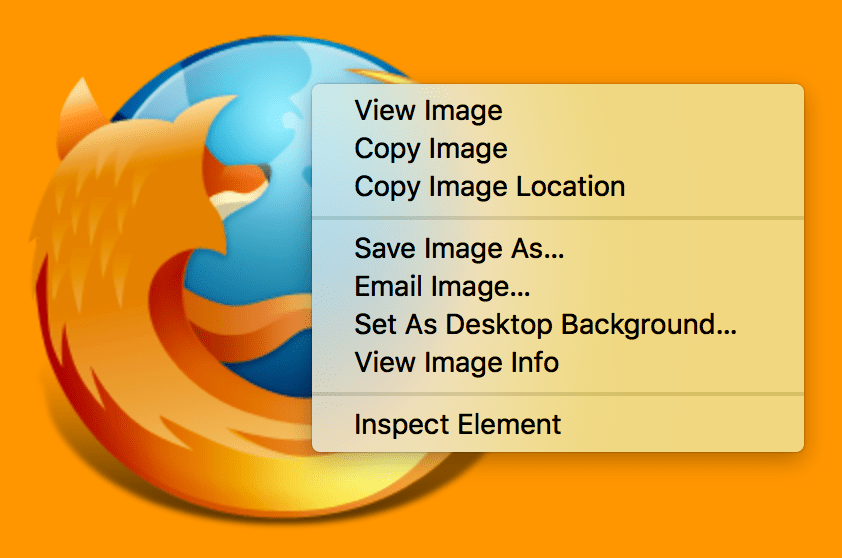
- Context menu: Press-and-hold/right-click an item on a webpage (Ctrl-click on the Mac), and choose Inspect Element from the context menu that appears. ( An added bonus: this method straight-away highlights the code of the element you right-clicked.)
The Inspector: DOM explorer and CSS editor
The developer tools usually open by default to the inspector, which looks something like the following screenshot. This tool shows what the HTML on your page looks like at runtime, as well as what CSS is applied to each element on the page. It also allows you to instantly modify the HTML and CSS and see the results of your changes reflected live in the browser viewport.
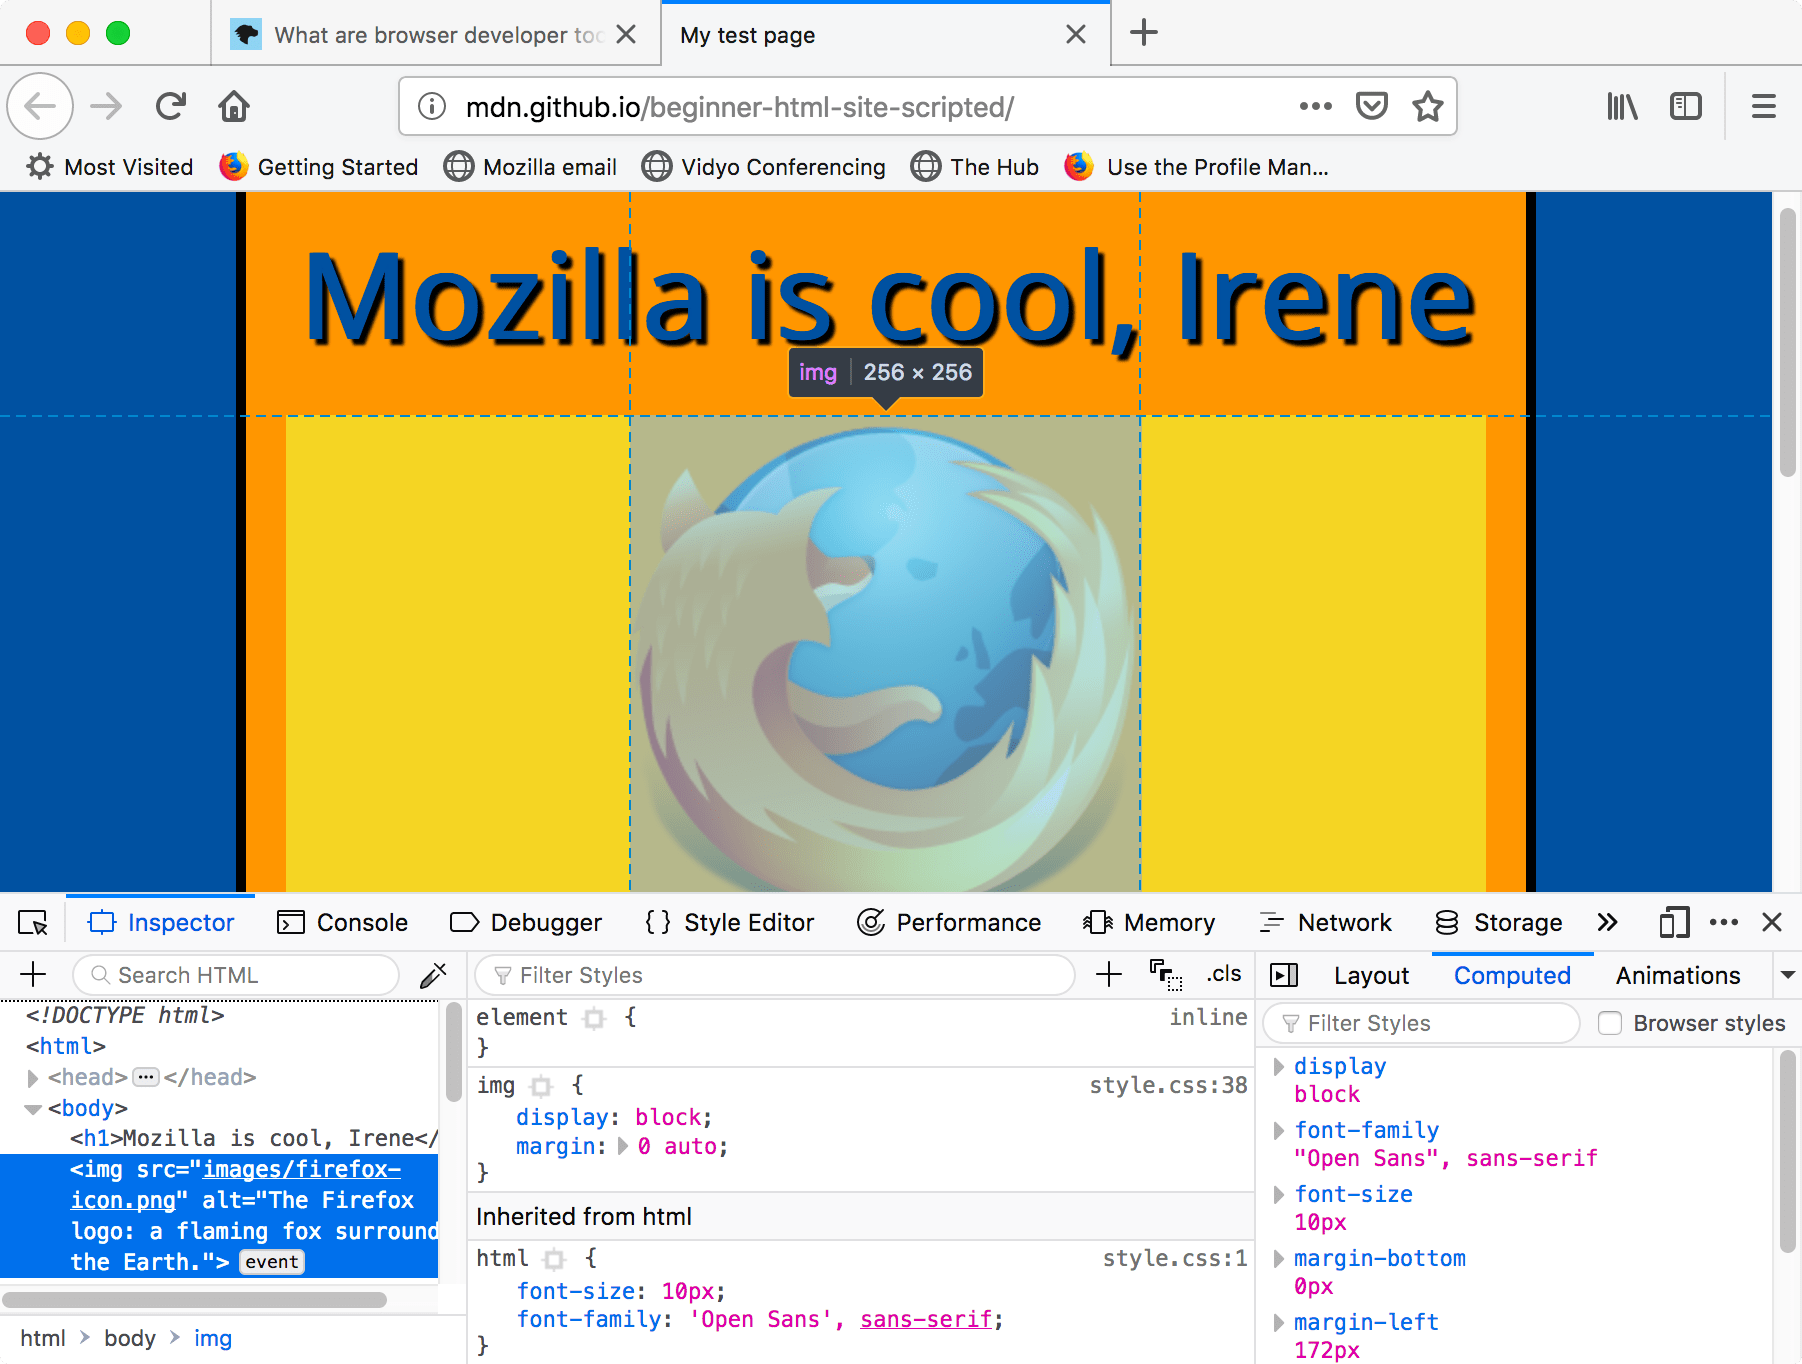
If you don't see the inspector,
- Tap/click the Inspector tab.
- In Chrome, Microsoft Edge, or Opera, tap/click Elements.
- In Safari, the controls are not so clearly presented, but you should see the HTML if you haven't selected something else to appear in the window. Press the Style button to see the CSS.
Exploring the DOM inspector
For a start, right-click (Ctrl-click) an HTML element in the DOM inspector and look at the context menu. The available menu options vary among browsers, but the important ones are mostly the same:
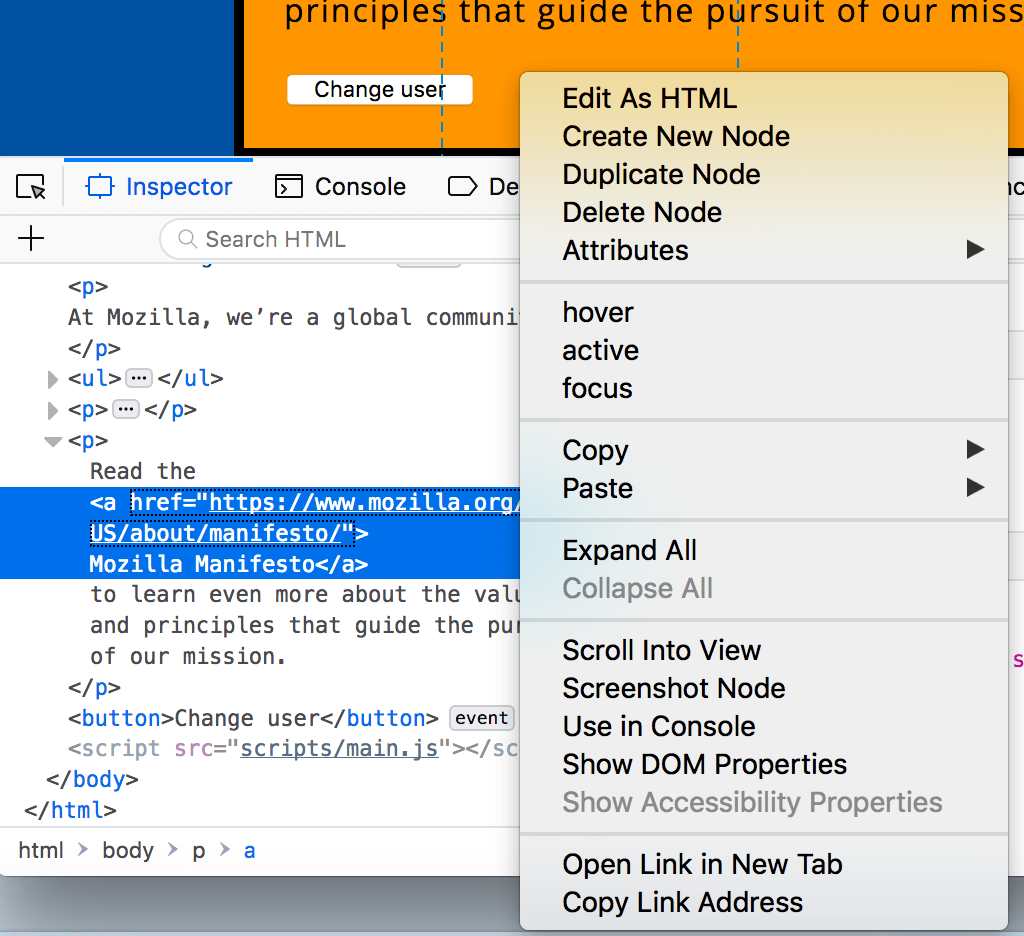
- Delete Node (sometimes Delete Element ). Deletes the current element.
- Edit as HTML (sometimes Add attribute / Edit text ). Lets you change the HTML and see the results on the fly. Very useful for debugging and testing.
- :hover/:active/:focus . Forces element states to be toggled on, so you can see what their styling would look like.
- Copy/Copy as HTML . Copy the currently selected HTML.
- Some browsers also have Copy CSS Path and Copy XPath available, to allow you to copy the CSS selector or XPath expression that would select the current HTML element.
Try editing some of your DOM now. Double-click an element, or right-click it and choose Edit as HTML from the context menu. You can make any changes you'd like, but you cannot save your changes.
Exploring the CSS editor
By default, the CSS editor displays the CSS rules applied to the currently selected element:
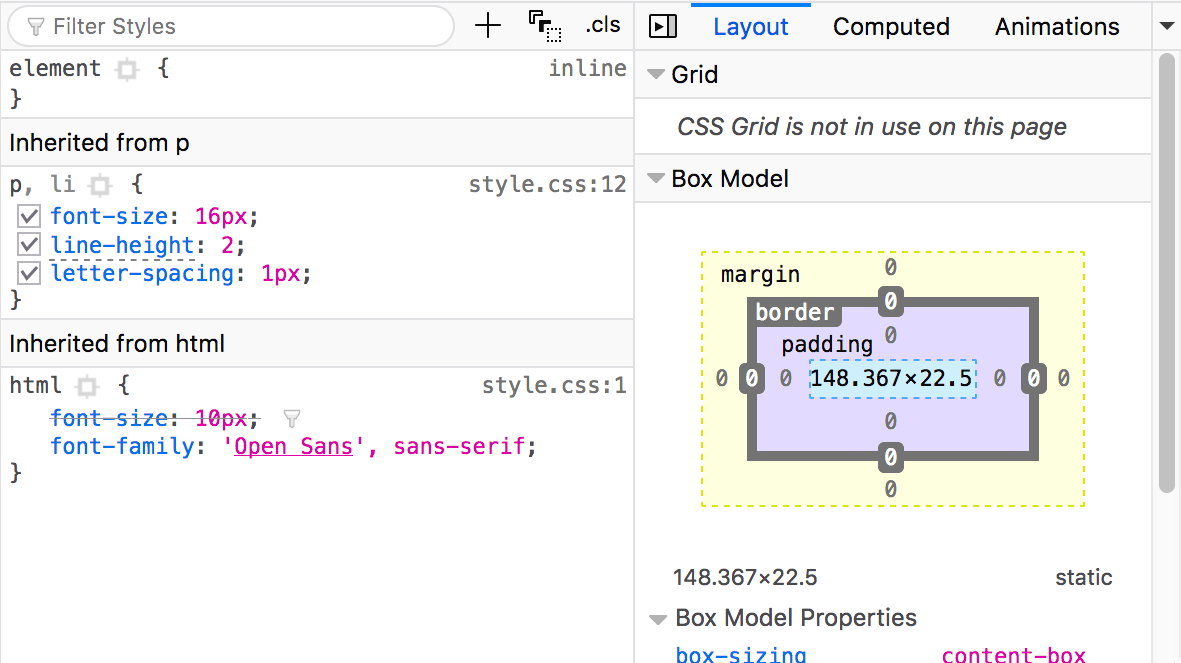
These features are especially handy:
- The rules applied to the current element are shown in order of most-to-least-specific.
- Click the checkboxes next to each declaration to see what would happen if you removed the declaration.
- Click the little arrow next to each shorthand property to show the property's longhand equivalents.
- Click a property name or value to bring up a text box, where you can key in a new value to get a live preview of a style change.
- Next to each rule is the file name and line number the rule is defined in. Clicking that rule causes the dev tools to jump to show it in its own view, where it can generally be edited and saved.
- You can also click the closing curly brace of any rule to bring up a text box on a new line, where you can write a completely new declaration for your page.
You'll notice a number of clickable tabs at the top of the CSS Viewer:
- Computed : This shows the computed styles for the currently selected element (the final, normalized values that the browser applies).
- Box Model : represents visually the current element's box model, so you can see at a glance what padding, border and margin is applied to it, and how big its content is.
- Grid : If the page you are inspecting uses CSS grid, this section allows you to view the grid details.
- Fonts : In Firefox, the Fonts tab shows the fonts applied to the current element.
Find out more
Find out more about the Inspector in different browsers:
- Firefox Page inspector
- Chrome DOM inspector (Opera's inspector works the same as this)
- Safari DOM inspector and style explorer
The JavaScript debugger
The JavaScript debugger allows you to watch the value of variables and set breakpoints, places in your code that you want to pause execution and identify the problems that prevent your code from executing properly.
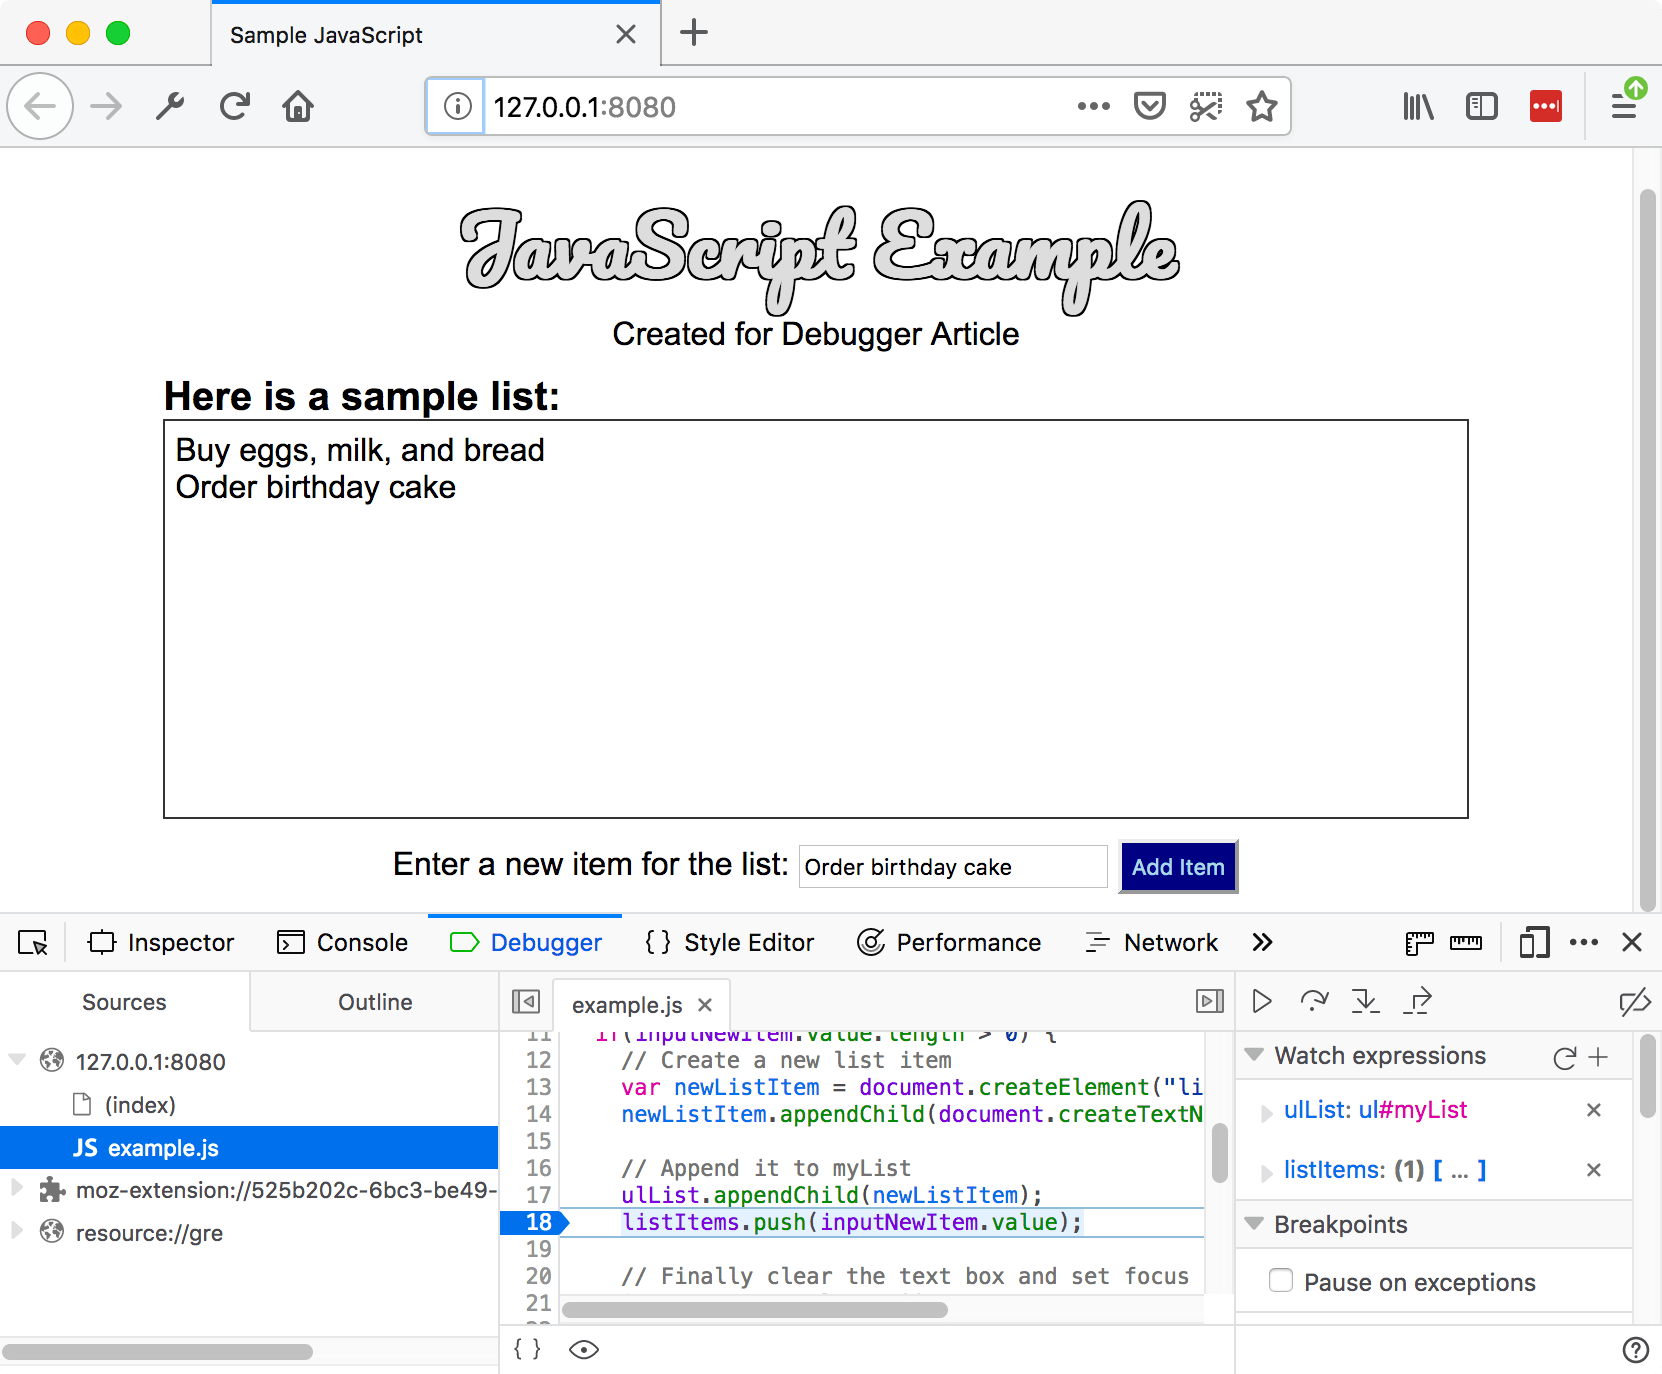
To get to the debugger:
Chrome : Open the Developer tools and then select the Sources tab. (Opera works the same way.)
Safari : Open the Developer Tools and then select the Debugger tab.

Exploring the debugger
There are three panes in the JavaScript Debugger on Firefox.
The first pane on the left contains the list of files associated with the page you are debugging. Select the file you want to work with from this list. Click on a file to select it and view its contents in the center pane of the Debugger.
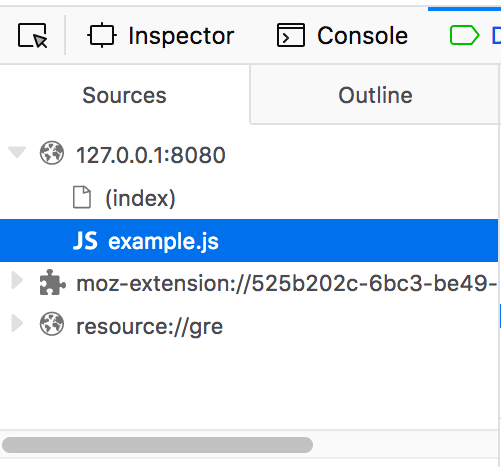
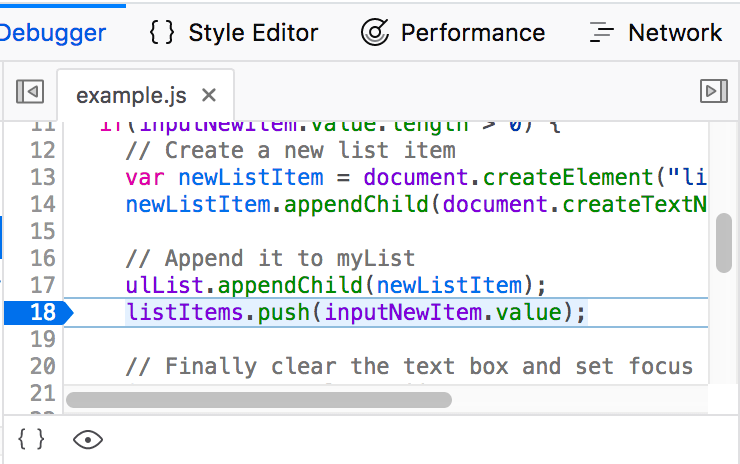
Source code
Set breakpoints where you want to pause execution. In the following image, the highlight on the number 18 shows that the line has a breakpoint set.
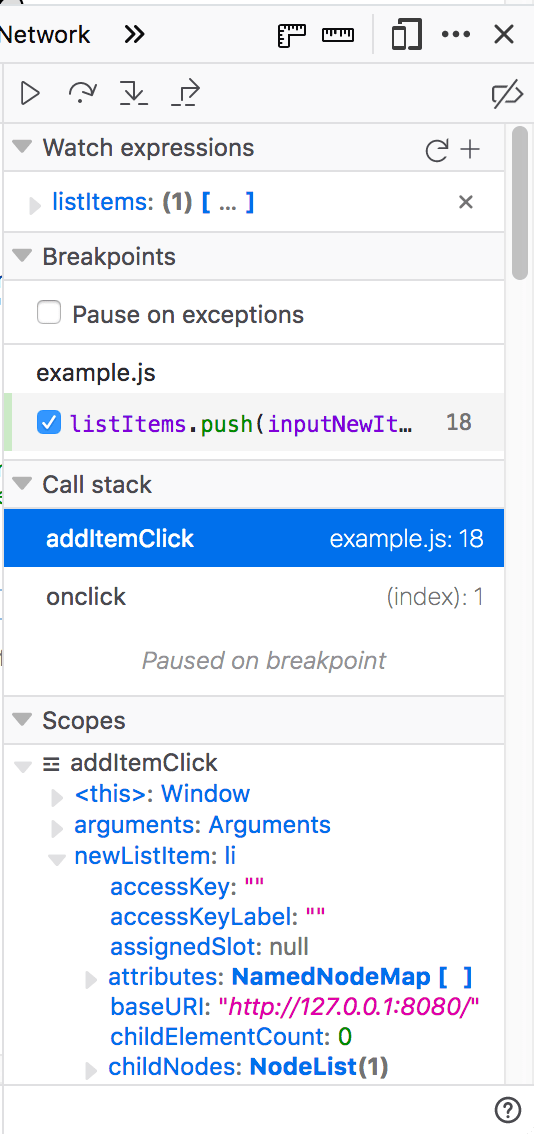
Watch expressions and breakpoints
The right-hand pane shows a list of the watch expressions you have added and breakpoints you have set.
In the image, the first section, Watch expressions , shows that the listItems variable has been added. You can expand the list to view the values in the array.
The next section, Breakpoints , lists the breakpoints set on the page. In example.js, a breakpoint has been set on the statement listItems.push(inputNewItem.value);
The final two sections only appear when the code is running.
The Call stack section shows you what code was executed to get to the current line. You can see that the code is in the function that handles a mouse click, and that the code is currently paused on the breakpoint.
The final section, Scopes , shows what values are visible from various points within your code. For example, in the image below, you can see the objects available to the code in the addItemClick function.
Find out more about the JavaScript debugger in different browsers:
- Firefox JavaScript Debugger )
- Microsoft Edge Debugger
- Chrome Debugger
- Safari Debugger
The JavaScript console
The JavaScript console is an incredibly useful tool for debugging JavaScript that isn't working as expected. It allows you to run lines of JavaScript against the page currently loaded in the browser, and reports the errors encountered as the browser tries to execute your code. To access the console in any browser:
If the developer tools are already open, click or press the Console tab.
This will give you a window like the following:

To see what happens, try entering the following snippets of code into the console one by one (and then pressing Enter):
Now try entering the following incorrect versions of the code and see what you get.
You'll start to see the kind of errors that the browser returns. Often these errors are fairly cryptic, but it should be pretty simple to figure these problems out!
Find out more about the JavaScript console in different browsers:
- Firefox Web Console
- Chrome JavaScript Console (Opera's inspector works the same as this)
- Safari Console
- Debugging HTML
- Debugging CSS
- Web Browser
- Google Chrome Browser
- Mozilla Firefox Browser
- Microsoft Edge Browser
- Apple Safari Browser
- Tor Browser
- Opera Browser
- DuckDuckGo Browser
- Brave Browser
Shortcuts for Safari Developer Tools
Safari Developer Tools are a big help for people who make websites. They provide features to check, fix, and improve web pages. Shortcuts are one of the best tools. They help you quickly and easily move through web development, making things faster.
Types of Shortcuts:
Table of Content
Navigation Shortcuts
Console shortcuts, debugger shortcuts, miscellaneous shortcuts, features of shortcuts.
- Inspect Element Shortcuts: Use quick keys to go fast through the DOM (Document Object Model) and check out how web parts are put together. Then, look closely at their structure for extra understanding of what’s going on in websites.
- Console Shortcuts: Use shortcuts to run JavaScript commands quickly, letting developers fix problems and test stuff using the console.
- Network Panel Shortcuts: Make checking network activities easier by using shortcuts to go through requests, answers and speed details.
- Source Code Shortcuts: Make fixing computer program errors easier by using quick ways to move through coding, put breakpoints and check what works.
Benefits of Shortcuts
- Time Efficiency: Shortcuts save time on boss tasks. They let builders do things fast and concentrate more important parts of building stuff.
- Enhanced Productivity: Developers can do more in less time. This makes them work faster and the development process smoother.
- Effortless Navigation: Shortcuts help you move easily between different parts of Developer Tools. This makes it feel smooth and easy to use.
How/When to use these Shortcuts?
- During Development: Add shortcuts to your daily tasks. This will assist you in tasks such as checking parts, solving coding issues and observing network actions quicker.
- Debugging Sessions: Shortcuts are really useful for fixing problems in code. They help programmers fast look at the code, slow it down in some spots and see things on a window called output for console.
- Performance Optimization: Shortcuts are your friends when trying to make a website work well. Use their power in the Network Panel to show performance dragons and make sure your users have a smooth experience.
Steps to Use/Implement
- Accessing Developer Tools: Enter the work area for making websites by right-clicking on your webpage, choosing “Inspect Element,” and going into the “Develop” list. You can also open the dev tools in safari by simply pressing option+command+c.
- Navigating Panels: Shortcuts are your special spells to move between different panels like Elements, Console, Network and Sources. Move smoothly through these areas like a skilled keyboard player.
- Inspecting Elements: Go to the core of your internet page using quick keys. Shine light on darkness with some easy button presses, looking carefully at different parts of the HTML like digital sleuth.
- Executing JavaScript: Use the Console Panel, your secret door to the world of JavaScript. Shortcuts let you cast spells (do commands) easily. They turn your computer screen into a magic potion of great code wonders.
- Monitoring Network Activity: In the Network Panel, shortcuts help you move through digital traffic. Follow requests, look at answers and make your computer run better with just a press of the keyboard.
Real Life Application
Picture a developer trying to solve the puzzle of an annoying layout problem on a website. Our programmer turns into a digital Sherlock with the help of shortcuts. Shortcuts help check parts of the webpage, move through it and change looks quickly. This helps solve problems. Pictures or small moving pictures show how shortcuts are used step-by-step. This is very helpful in figuring things out practically.

Please Login to comment...
Similar reads.
- Geeks Premier League
- Web Browsers
- Geeks Premier League 2023
- Best PS5 SSDs in 2024: Top Picks for Expanding Your Storage
- Best Nintendo Switch Controllers in 2024
- Xbox Game Pass Ultimate: Features, Benefits, and Pricing in 2024
- Xbox Game Pass vs. Xbox Game Pass Ultimate: Which is Right for You?
- Full Stack Developer Roadmap [2024 Updated]
Improve your Coding Skills with Practice
What kind of Experience do you want to share?
12 Best CSS Tools for Developers (or Anyone Else)
Published: September 11, 2024
Whether you‘re an experienced front-end developer or someone who’s just dabbling in CSS (that‘s me!), you’ll probably agree with me that having to write all your CSS from scratch is just plain annoying.

So — why do it? Instead of typing away furiously in your code editor, get some help from the CSS tools that I've curated in this list.

If you‘re already a front-end developer, these tools will help you save time and work more efficiently with CSS. And if you’re not a developer, these tools will help you access new CSS abilities that you might not have with your own knowledge.
What Is a CSS Tool?
A CSS tool is any type of tool that helps you work more efficiently with CSS . Some tools offer a full-service approach to CSS, such as letting you fully customize a website's CSS via a graphical interface. Other tools offer a more targeted approach for working with specific areas of CSS, such as helping you generate the CSS for a flexible grid or a pure CSS background.
In my list of the best CSS tools, I've tried to offer the most value by collecting both types of tools.
Whether you want an all-purpose tool that you can use for all different types of CSS or you're looking for help with a specific area of CSS (such as a CSS generator for part of your design), you should be able to find a great option on this list.
Pro tip: If you want to discover even more ways to work more efficiently with CSS, you can also check out HubSpot's free collection of 50 coding templates . It includes a number of CSS templates for accordions, tab navigation, slideshows, backgrounds, and more.
The Best CSS Tools on the Market
- CSS Grid Generator
- CSS Layout Generator
- Smooth Shadow
- MagicPattern CSS Background Generator
- Neumorphism.io
1. CSS Grid Generator
Best for : Generating custom CSS grids for use in your designs.
As a marketer (and not a front-end developer), I always found it difficult to work with CSS grids.
The CSS Grid Generator from sarah_edo solves that pain point by offering an easy way to set up all different kinds of grids. Whether you‘re an experienced developer or a marketer like me, I think you’ll find this tool really handy.
All you need to do is enter the number of columns and rows that you want, along with the gap between them. You can then click or use drag-and-drop on the live preview to create divs within the grid structure.
You can also easily adjust the height or width of any row or column in the grid using the boxes above and beside the preview.

Free Website Design Inspiration Guide
77 Brilliant Examples of Homepages, Blogs & Landing Pages to Inspire You
- Agency Pages
- Ecommerce Pages
- Tech Company Pages
Download Free
All fields are required.
You're all set!
Click this link to access this resource at any time.
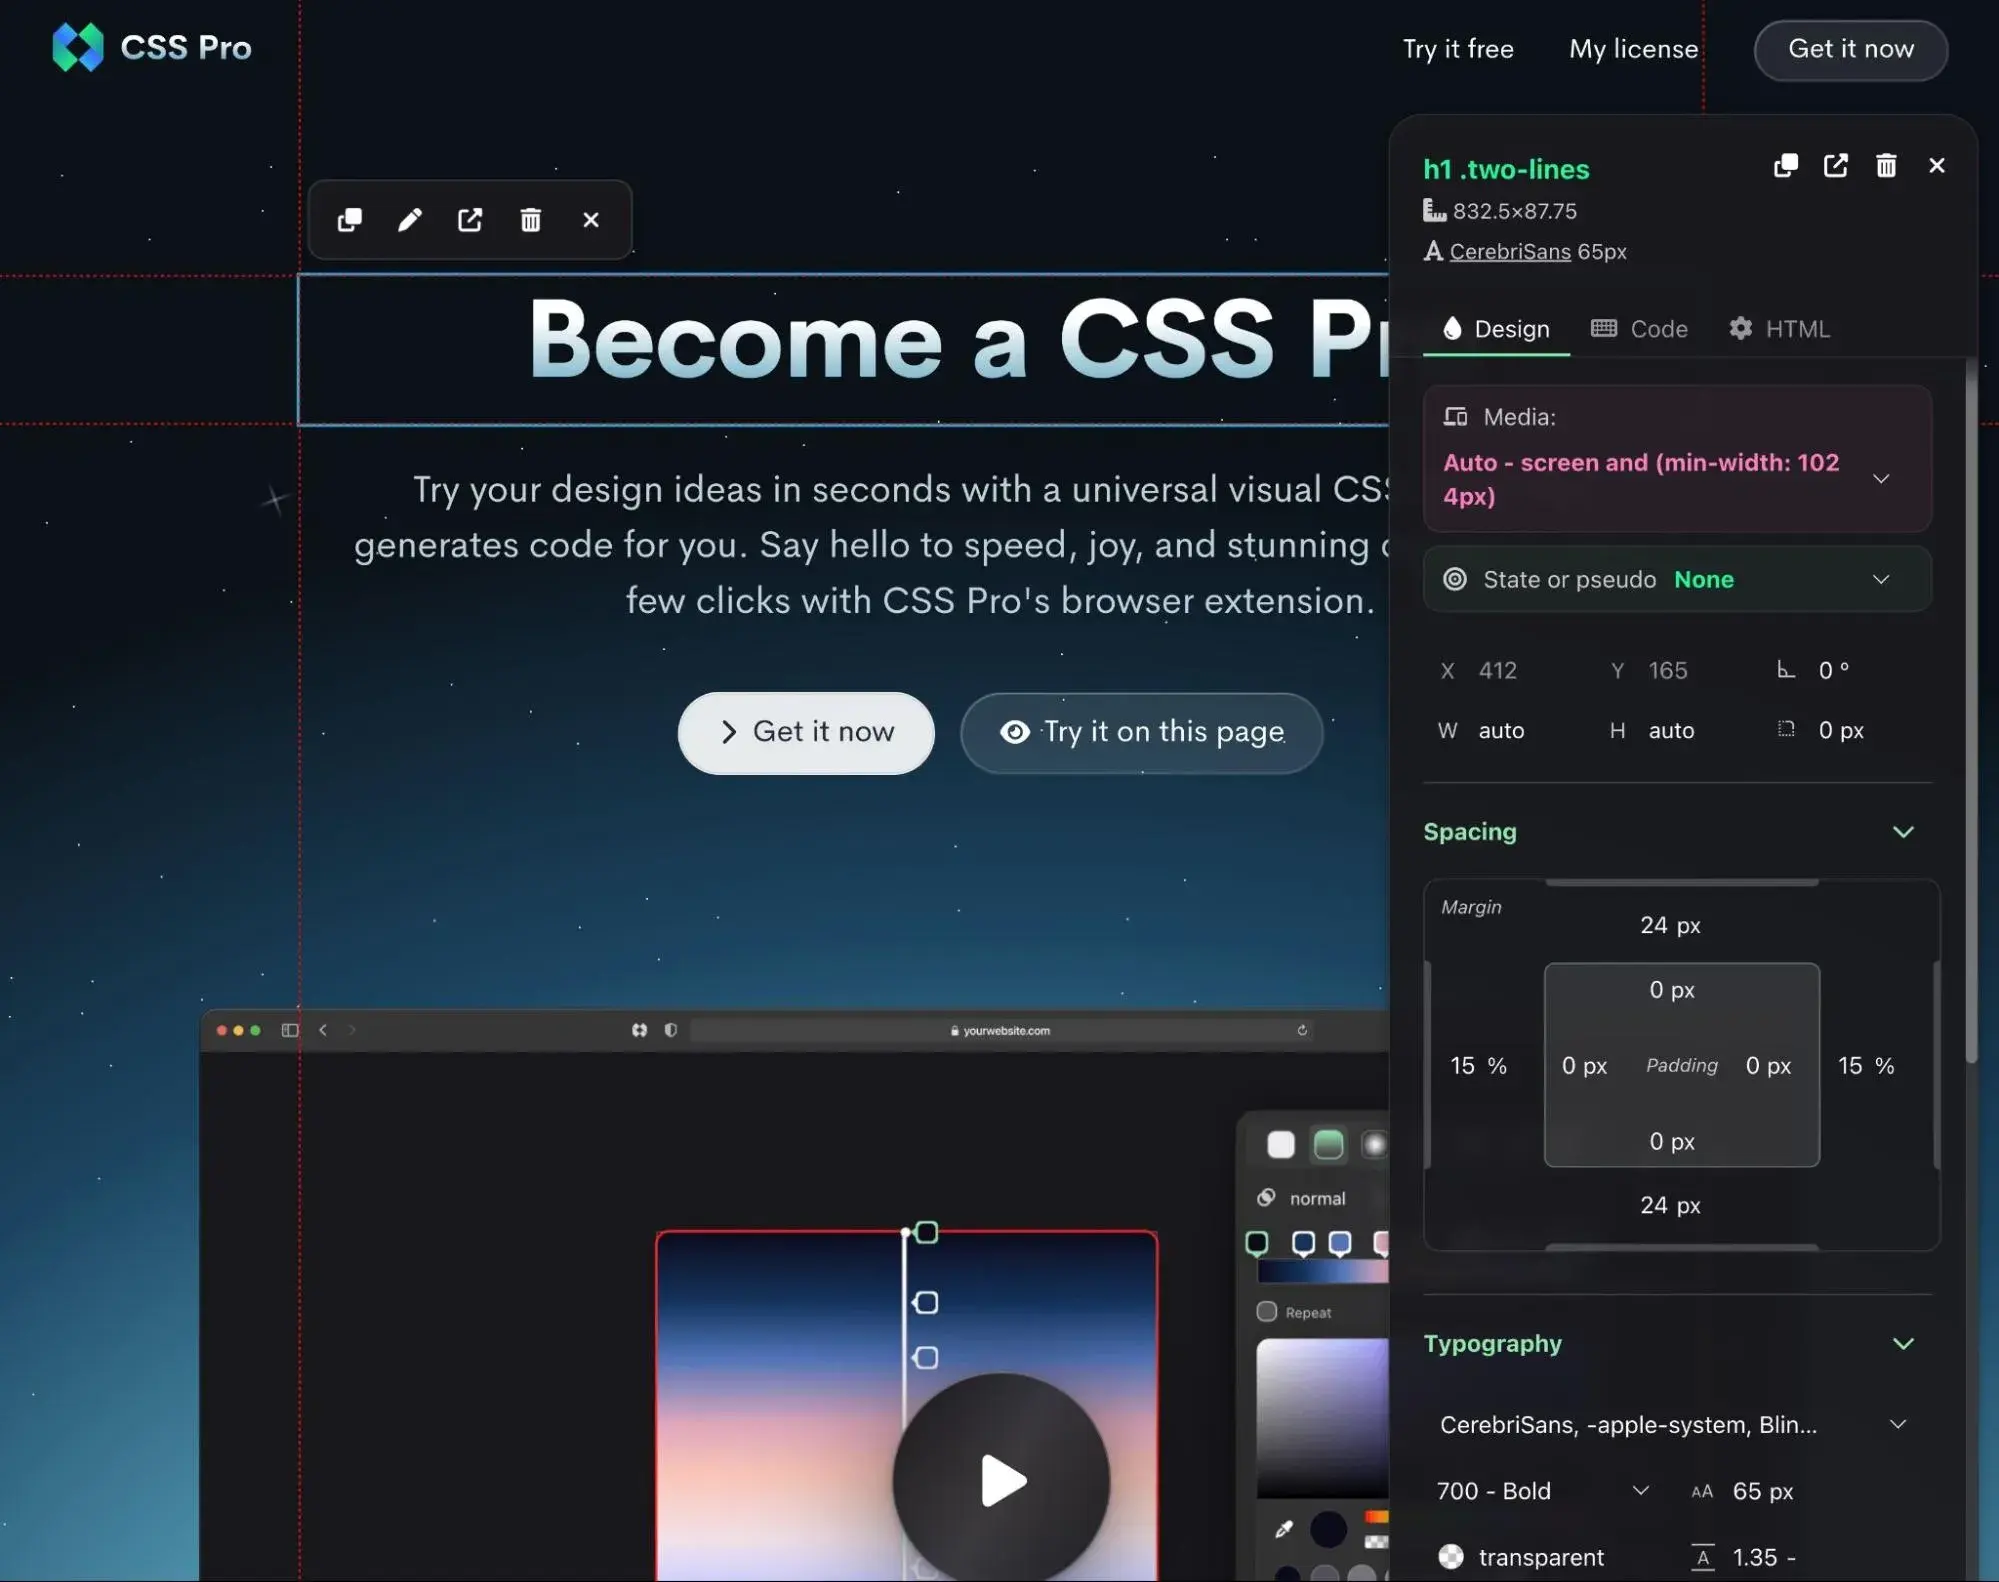
As a marketer, I love this approach because it gives me the ability to customize any element without requiring any technical knowledge. If you are more familiar with CSS, CSS Pro also still gives you the ability to edit the CSS code directly if you'd prefer to dive into the code for a specific change.
Basically, if you‘re not very technical, it will give you a bunch of new abilities to use CSS in interesting and helpful ways. And if you’re already a front-end developer, it still might speed up your workflows by letting you get stuff done more quickly.
9. PurifyCSS
Best for : Removing unused CSS from your project.
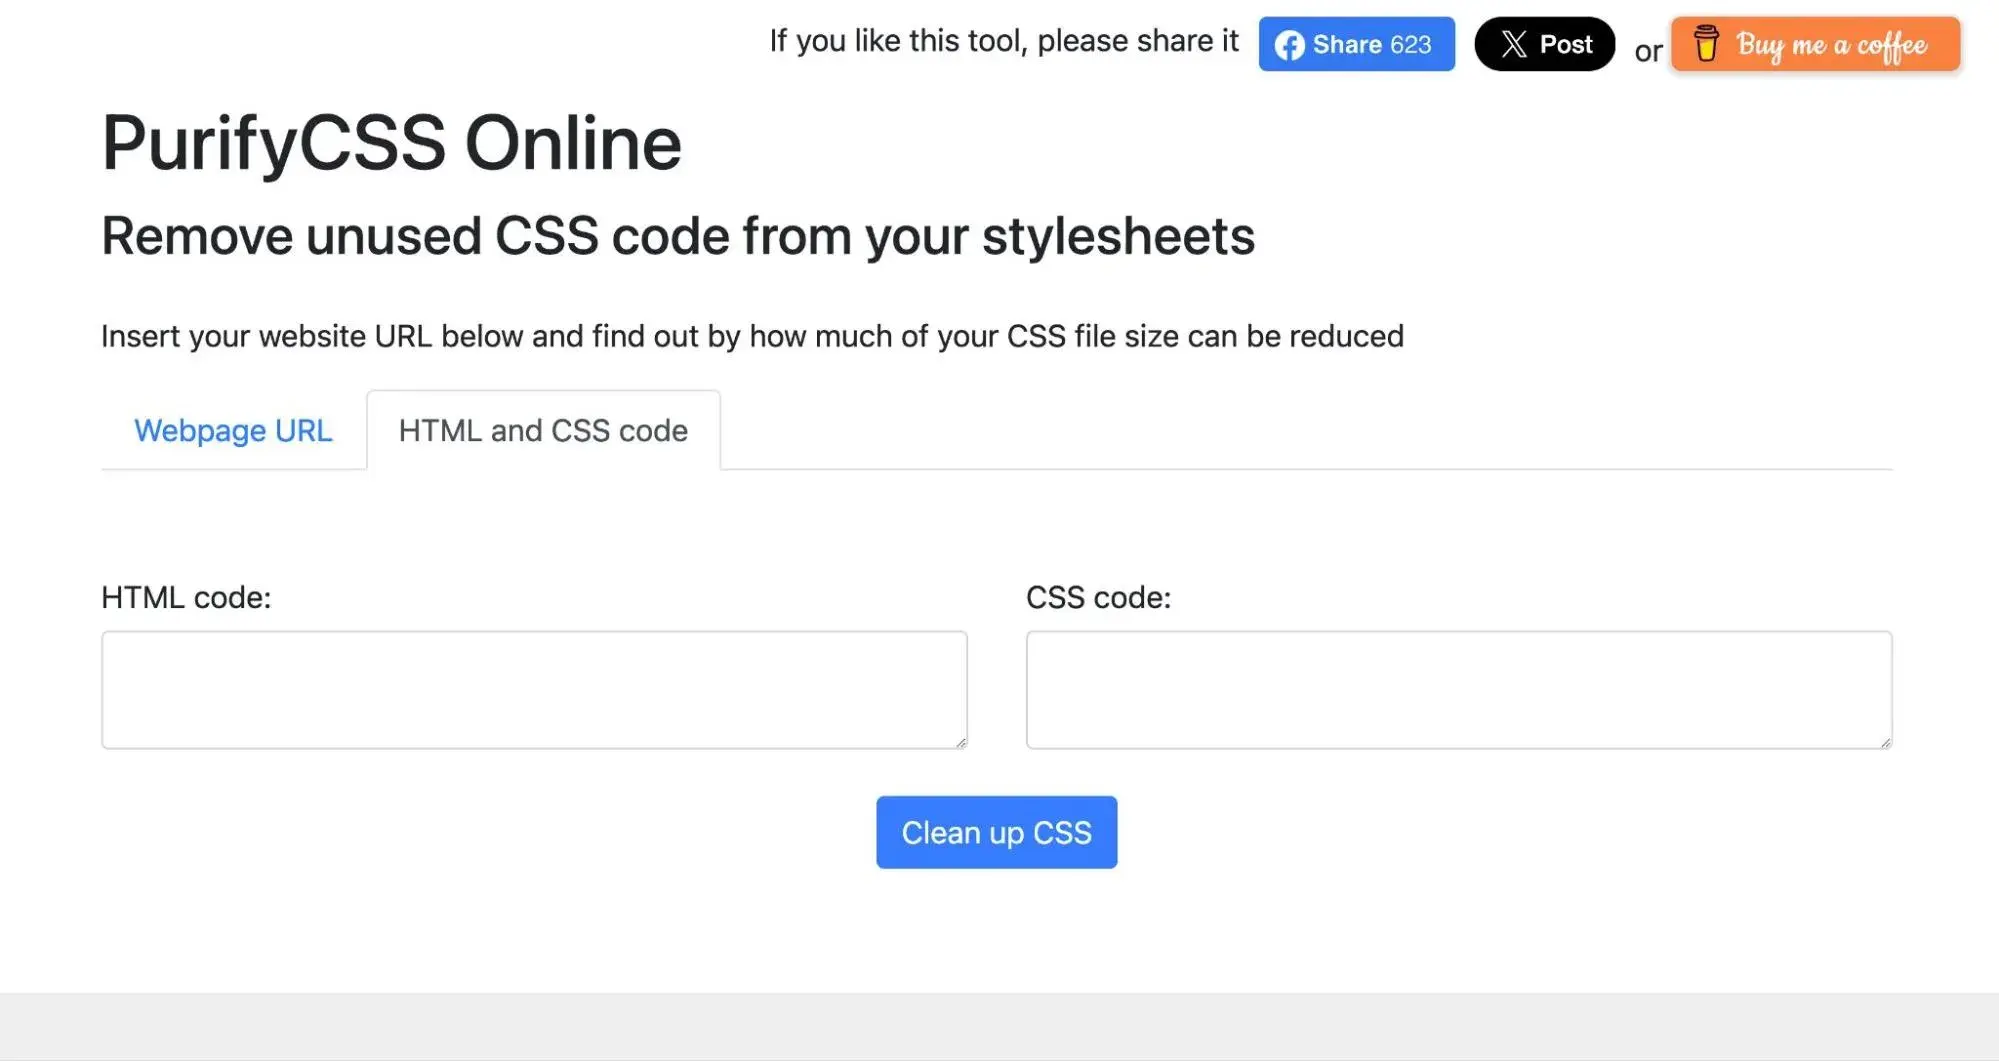
PurifyCSS is a tool that can help you remove unused CSS from your project.
It works by scanning your entire project and returning only the used CSS. It will not modify the original CSS files. Instead, you can use the results to write to a new CSS file that you can use in your final version.
While this can help for all projects, it‘s especially useful if you’re using a CSS framework , as many of the CSS framework selectors will be unused.
For example, if you used the popular Bootstrap CSS framework , this tool can help you remove all of the unused CSS from your finished project.
Personally, I love most of the CSS generators, as they let me access new design abilities that I, as a marketer, wouldn‘t normally be able to implement. But if you’re looking for a more all-purpose tool, I think that CSS Scan and CSS Pro are two great options to consider.
Don't forget to share this post!
Related articles.

13 Best HTML & CSS Code Editors for 2024
![developer tools safari How to Center an Image with HTML and CSS [+ Code Modules]](https://www.hubspot.com/hubfs/center-an-image-in-html.jpg)
How to Center an Image with HTML and CSS [+ Code Modules]
How to Create a Video Background with CSS
![developer tools safari How to Import Bootstrap in React [The Beginner's Guide]](https://www.hubspot.com/hubfs/import-bootstrap-in-react.jpg)
How to Import Bootstrap in React [The Beginner's Guide]
![developer tools safari How to Create Scrolling Text With CSS [+ Code Examples]](https://www.hubspot.com/hubfs/Google%20Drive%20Integration/scrolling%20text%20css.jpeg)
How to Create Scrolling Text With CSS [+ Code Examples]

How to Draw a Circle Using the CSS Border Radius Property

How to Set Opacity of Images, Text & More in CSS

How to Hide the Scrollbar in CSS

How to Center Text & Headers in CSS Using the Text-Align Property

How to Change HTML Font & Font Color
77 of blog and website page design examples.
CMS Hub is flexible for marketers, powerful for developers, and gives customers a personalized, secure experience
This page requires JavaScript.
Please turn on JavaScript in your browser and refresh the page to view its content.
Safari User Guide
- Get started
- Go to a website
- Bookmark web pages to revisit
- See your favourite websites
- Use tabs for web pages
- Import bookmarks and passwords
- Pay with Apple Pay
- Autofill credit card info
- View links from friends
- Keep a Reading List
- Hide ads when reading
- Translate a web page
- Download items from the web
- Add passes to Wallet
- Save part or all of a web page
- Print or create a PDF of a web page
- Interact with text in a picture
- Change your home page
- Customise a start page
- Create a profile
- Block pop-ups
- Make Safari your default web browser
- Hide your email address
- Manage cookies
- Clear your browsing history
- Browse privately
- Prevent cross-site tracking
- See who tried to track you
- Change Safari settings
- Keyboard and other shortcuts
Use the developer tools in the Develop menu in Safari on Mac
If you’re a web developer, the Safari Develop menu provides tools you can use to make sure your website works well with all standards-based web browsers.
If you don’t see the Develop menu in the menu bar , choose Safari > Settings, click Advanced, then select “Show features for web developers”.
Open Safari for me

IMAGES
VIDEO
COMMENTS
If you're a web developer, the Safari Develop menu provides tools you can use to make sure your website works well with all standards-based web browsers. If you don't see the Develop menu in the menu bar, choose Safari > Settings, click Advanced, then select "Show features for web developers.". See also Change Advanced settings in ...
Learn how to use Web Inspector, Responsive Design Mode, and other tools to create and debug web pages on Safari. Safari is a powerful browser that supports web standards and performance optimization.
Overview. The Develop menu is home to the tools available to design and develop web content in Safari, as well as web content used by other applications on your Mac and other devices. The Develop menu also provides quick access to Changing Developer settings in Safari on macOS and Changing Feature Flag settings in Safari on macOS.. Note. If you haven't already enabled features for web ...
Safari for developers. Safari is the best way to experience the internet on iPhone, iPad, and Mac. Thanks to blazing-fast performance and industry-leading energy efficiency, millions of users enjoy exploring the web with Safari. Take advantage of powerful new features, advanced developer tools, and cutting-edge technologies in Safari to deliver ...
Learn how to enable the Develop menu in Safari to access features like Show Page Source and Inspect Element. The Develop menu lets you view the source code of any website, download images, and debug code.
Learn how to use Apple Safari's built-in developer tools to inspect and debug your web applications. This article covers the features and functions of the Web Inspector, Console, Network, Debugger, and Timeline tabs.
Access the "Develop" Menu: Click on the "Develop" option in the menu bar. If you don't see the "Develop" menu, you may need to enable it first. To do this, go to "Safari" > "Preferences" > "Advanced" and check the box next to "Show Develop menu in menu bar." Open Developer Tools: Once you have accessed the "Develop" menu, you will find a list ...
Learn how to inspect, debug, and test web content in Safari and other platforms using various tools and settings. Find topics on Web Inspector, Responsive Design Mode, WebDriver, and more.
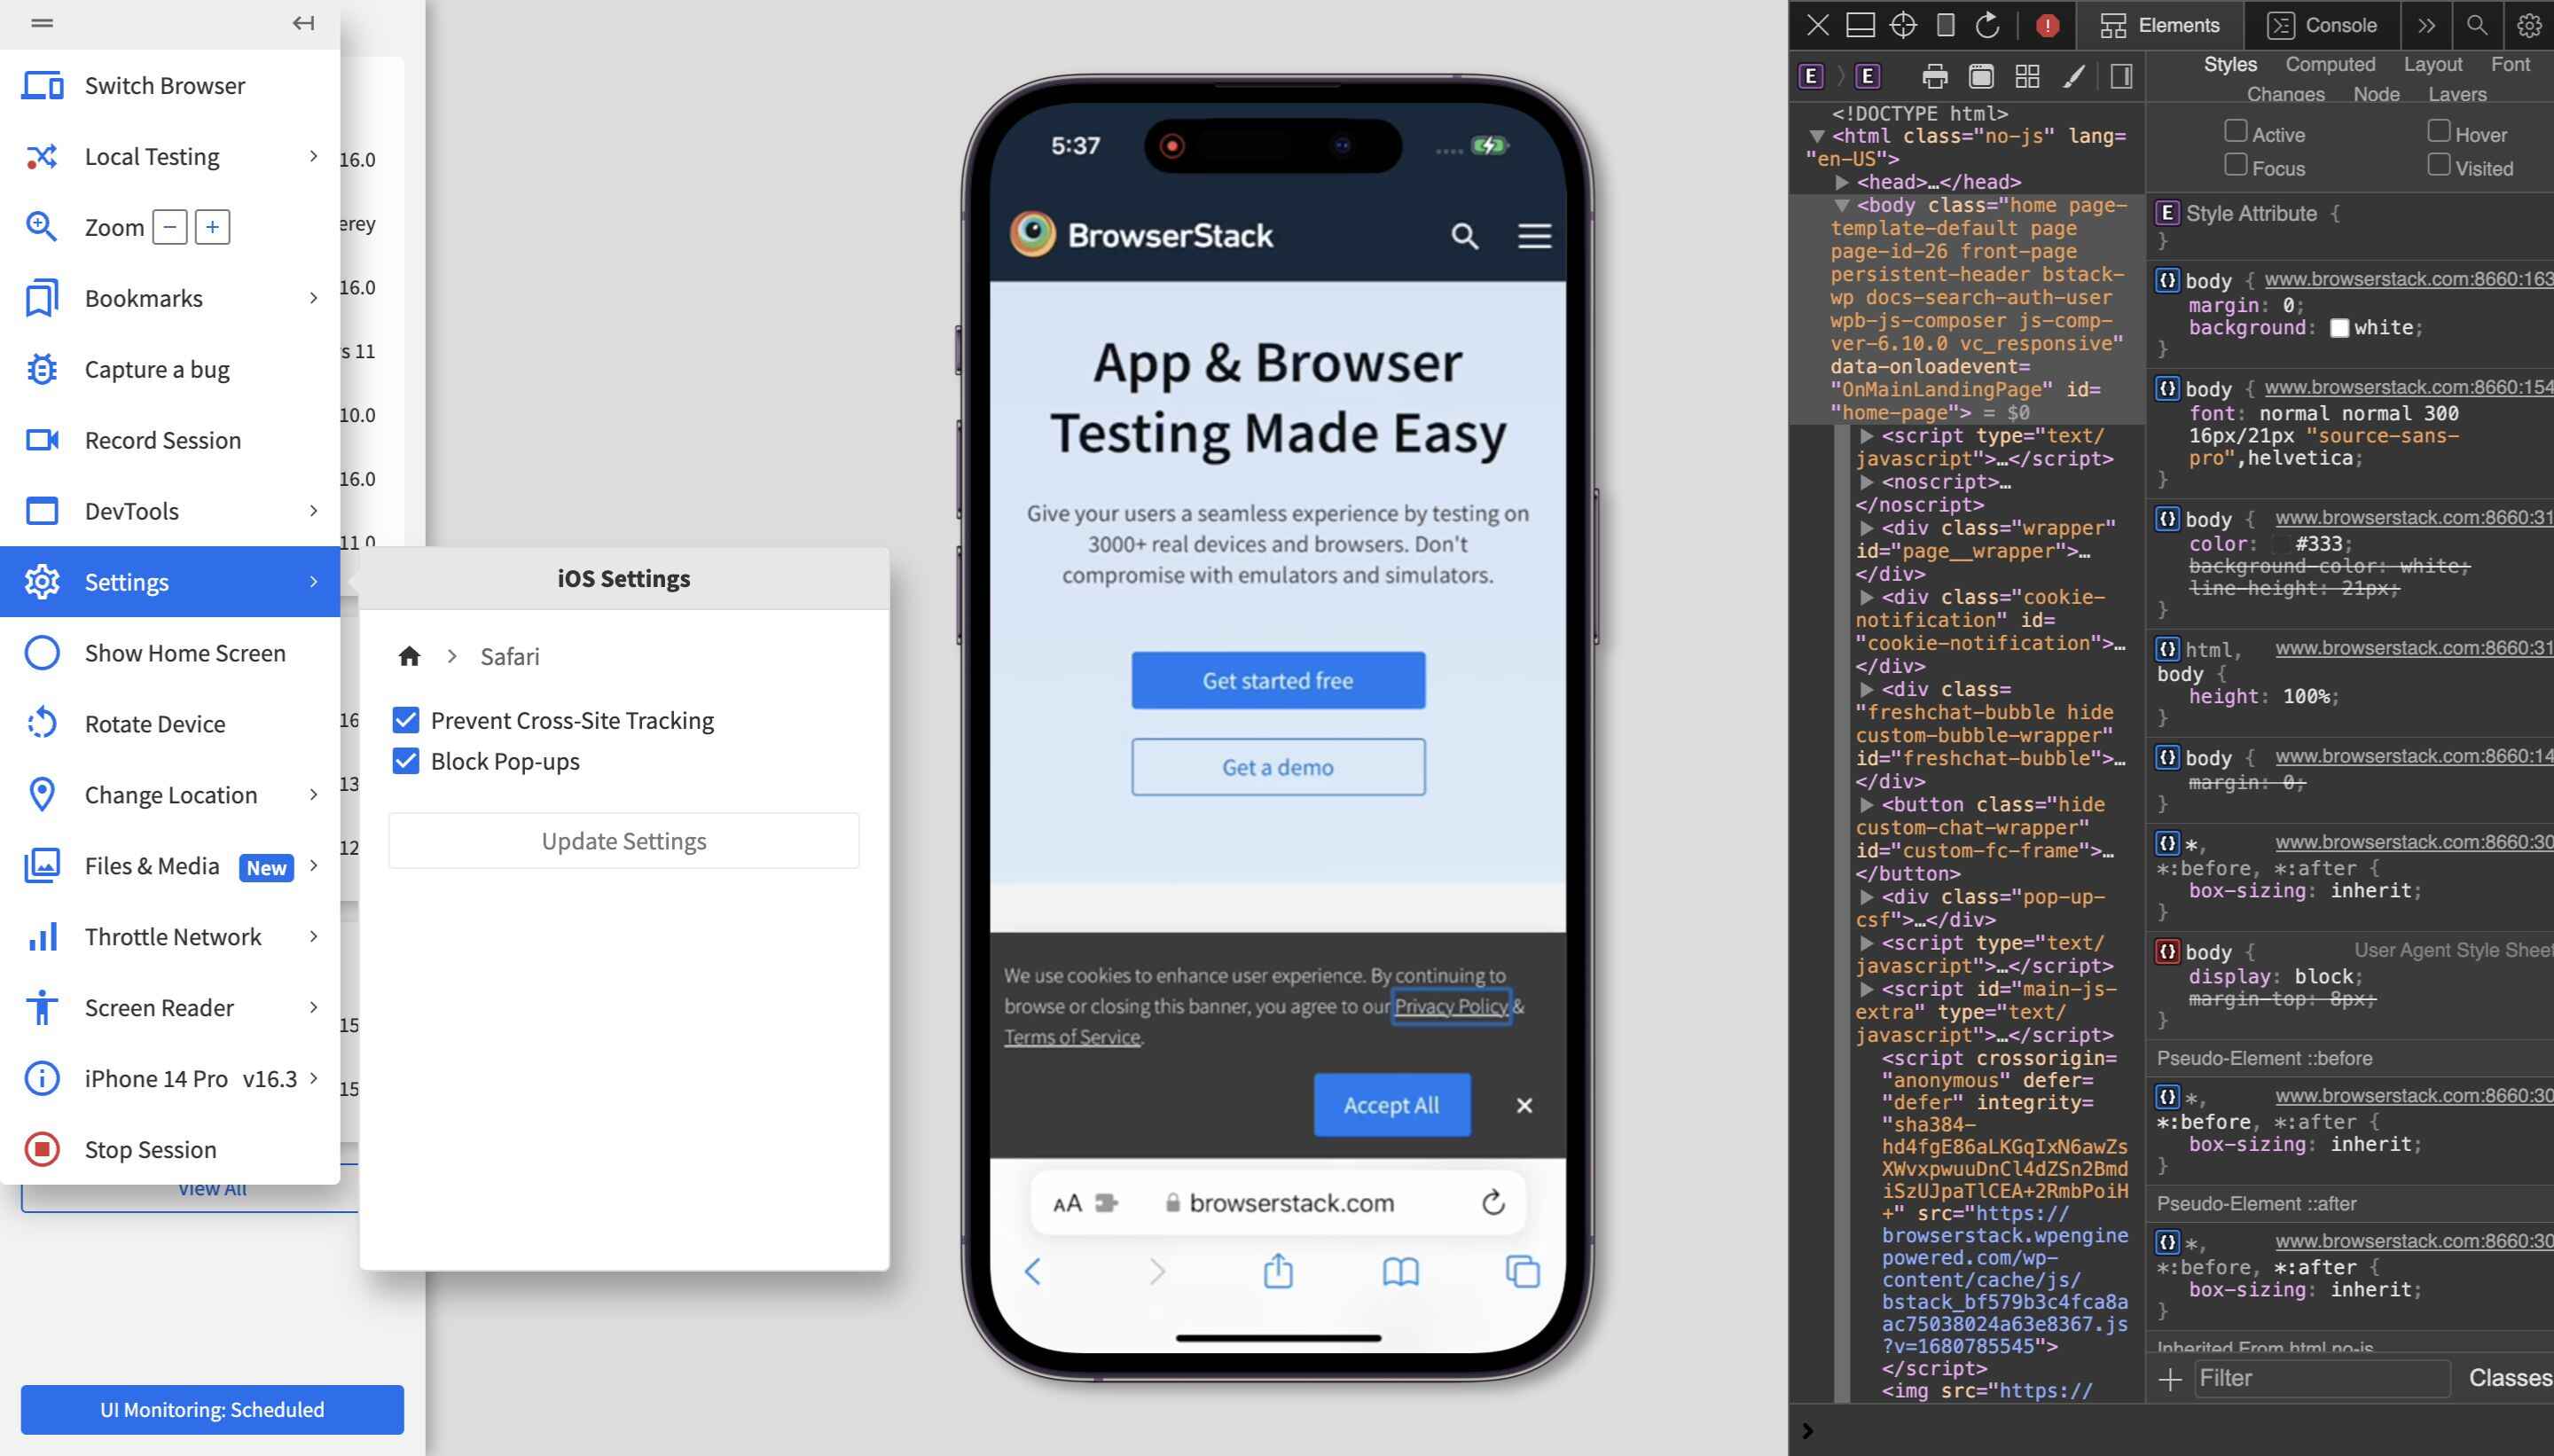
Learn how to use Safari Developer Tools to inspect, debug, and optimize your web applications on Apple devices. Compare two methods: Responsive Design Mode and BrowserStack Live, and see the steps and screenshots for each.
Learn how to access and use the developer tools in Safari on Mac and iOS devices to inspect, debug, and optimize web content. Follow the simple steps to enable the develop menu, show web inspector, and enter inspect:// in the address bar.
Learn how to enable and use Safari's built-in Developer Tools for web development and debugging. Explore the features and functionalities of these tools, such as inspecting and modifying web page elements, debugging JavaScript, analyzing network activity, and optimizing website performance.
The Safari Developer Tools for the macOS browser can be enabled and displayed in Safari > Preferences > Advanced > "Show Develop menu in menu bar" for Safari version 14 and earlier.. Then from the Safari "Develop" menu select "Show Web Inspector" or use the keyboard shortcut Option+Command+i When opened the Safari developer tools pops open in a new window, to get it docked to the ...
On the ipad go to Settings > Safari > Advanced and activate the Web Inspector. Connect your ipad with your computer. On your computer open Safari, enable the developer tools in the settings. check the above menu for the tab Developer and find your iPad there. Full control via console from your desktop machine over the iOS Safari and you're done ...
Firefox: Select Web Developer Debugger or press Ctrl + Shift + S to open the JavaScript Debugger. If the tools are already displayed, click on the Debugger tab. Chrome: Open the Developer tools and then select the Sources tab. (Opera works the same way.) Safari: Open the Developer Tools and then select the Debugger tab.
Use the developer tools in the Develop menu in Safari on Mac. If you're a web developer, the Safari Develop menu provides tools you can use to make sure your website works well with all standards-based web browsers. If you don't see the Develop menu in the menu bar, choose Safari > Preferences, click Advanced, then select "Show Develop ...
Safari Developer Tools are a big help for people who make websites. They provide features to check, fix, and improve web pages. Shortcuts are one of the best tools. They help you quickly and easily move through web development, making things faster. Types of Shortcuts:Table of Content Navigation ShortcutsConsole ShortcutsDebugger ShortcutsMiscellan
Safari on macOS has several tools for web developers, including the Develop menu, Web Inspector, and WebDriver, which are turned off by default. To enable these tools: From the menu bar, choose Safari. Select Settings… (⌘,). Go to the Advanced pane. Check the Show features for web developers checkbox. Current page is Enabling features for ...
The Safari developer mode consists of a suite of tools meant to help web developers design, troubleshoot, and speed up their websites and Web apps. These functions contribute towards refining web development by incorporating measures that can be used to examine, revise, or evaluate web content. The bulk of Safari Developer Mode is composed of Safar
If you're already a front-end developer, these tools will help you save time and work more efficiently with CSS. ... It has extensions for Chrome, Firefox, and Safari. Price: $30 per month with monthly billing or $15 per month with annual billing ($180). There's also a lifetime option that costs $900 one time for lifetime usage. 4.
Disable site-specific hacks. On rare occasions, when a particular website does not work correctly in Safari, modifications are made in browser code to get that site to work. This setting disables such modifications to make it possible for the site's developers to debug their problem. If there are no site-specific hacks, this setting has no ...
If you're a web developer, the Safari Develop menu provides tools you can use to make sure your website works well with all standards-based web browsers. If you don't see the Develop menu in the menu bar, choose Safari > Settings, click Advanced, then select "Show features for web developers.". See also Change Advanced settings in ...
iOS development has become a lucrative field for anyone interested in iPhone app development and creating apps for iPads and other Apple devices.With millions of apps available in the App Store, developers need the right ios app development software to design, build, and test their apps effectively.. Whether you're just starting out or you're a seasoned developer looking to boost your ...
Web Inspector helps you inspect all the resources and activity on webpages, Service Workers, Mac and Home Screen web apps, and JavaScript running inside your applications, making development more efficient across Apple platforms. The clean, unified design puts each core function in a separate tab, which you can rearrange to fit your workflow.
If you're a web developer, the Safari Develop menu provides tools you can use to make sure your website works well with all standards-based web browsers. If you don't see the Develop menu in the menu bar, choose Safari > Settings, click Advanced, then select Show features for web developers. Safari for Developers. .
If you're a web developer, the Safari Develop menu provides tools you can use to make sure your website works well with all standards-based web browsers. If you don't see the Develop menu in the menu bar, choose Safari > Settings, click Advanced, then select "Show features for web developers". Safari for Developers. .