

How to Use React DevTools in Safari
Published on Jun 09, 2023 in platforms by Lucien Chemaly 11 minute read
React is commonly used for the frontend in static site generators like Gatsby and now WordPress . React DevTools is a set of developer tools with a multitude of features that can make your workflow more efficient and help you debug and optimize your code.
However, if you use Safari, you may be disappointed to learn that there is no browser extension for React DevTools like there is in Chrome and Firefox.
Fortunately, there is a solution. You can still use standalone React DevTools to connect to your site in Safari. This practical tool is also useful for debugging non-browser-based React applications, like React Native apps. It can help simplify the process of optimizing and debugging your code, making your workflow more efficient.
In this article, you’ll learn how to install and use the standalone version of React DevTools to debug a React application running in Safari. In addition, the article also highlights the differences between the standalone version and the Chrome extension, as well as some limitations of the tools.
Use Cases for Debugging React Apps
The standalone version of React DevTools is a separate application that provides a powerful set of debugging and inspection tools for React applications. It’s independent of any specific browser and can be used across various platforms and environments. This makes it a versatile option for developers who need to debug their React apps in different contexts.
Some of the use cases for the standalone version of React DevTools include:
- Debugging non-browser-based React apps: The standalone version of React DevTools is particularly useful when debugging React Native applications because it is platform-independent and can connect to apps running on iOS or Android devices. For example, you can use it to determine why a specific component of your React Native app isn’t rendering correctly on an iOS device. You can use React DevTools to inspect the component tree, check component props and state, and identify issues with styling or logic that may be causing the rendering problem.
- Debugging React apps in Safari: Safari is a widely used browser, especially among macOS users. Although Safari has its own set of developer tools, it doesn’t have extensions or support for React applications like Chrome or Firefox. The standalone version of React DevTools can be used to debug React applications running in Safari, as it provides developers with a powerful set of tools to inspect components and diagnose issues. For instance, if a specific UI component in your React app doesn’t behave as expected when viewed in Safari, you can use React DevTools to inspect the component in question. You can check its state and props and identify any issues.
- Debugging server-rendered React apps: In most static site generators, React apps are server-rendered, which means components are rendered on the server side and sent as HTML to the client. In these scenarios, the standalone version of React DevTools can help you debug issues related to server-rendered components. For example, if you’re using a solution like Next.js or React Server Components to perform server-side rendering, you can use the standalone version of React DevTools to inspect the rendered components and identify issues related to data fetching, state management, or rendering logic.
How to Debug a React App in Safari
The following tutorial explains how to use the standalone version of React DevTools to debug a React application running in Safari. By the end, you’ll be equipped with the knowledge and tools you need to confidently debug your React application.
Prerequisites
To complete this tutorial, you’ll need:
- A Mac running Safari
- A code editor, such as Visual Studio Code
- Git installed on your machine
- Node.js and npm (the Node package manager) installed on your system
To verify the installation of Node.js and npm, execute these commands in your shell or terminal:
If they aren’t installed, download and install Node.js , which also automatically installs npm. This tutorial uses Node version 18.12.1 and npm version 8.19.2.
Creating a React Demo Application
You’ll first need to set up a basic React demo application, which you’ll run and debug in your Safari browser using the standalone version of React DevTools.
Create a new React project using Create React App by executing this command:
This command will generate a new folder with the specified name and populate it with boilerplate code for a React application.
Change the current directory to your newly created project folder by running the following command:
Execute the following command to start the development server:
Your React application should now be live at http://localhost:3000/ . Use your Safari browser to open the application:

Any modifications made to the source code will trigger an automatic page refresh.
Connecting Standalone React DevTools to Your App in Safari
To connect React DevTools to your app in Safari, you first need to install the standalone React DevTools package using npm from your terminal or shell:
Run React DevTools with this command:
After you run the command, you’ll get the following screen telling you to add an additional script to your React DOM :

This tutorial uses the script with the localhost link ( <script src="http://localhost:8097"></script> ) to connect the React application, but the LAN IP address also works. Since you’re not working with a mobile application, the localhost link will work just fine.
Go to your source project and open the index.html file in the public folder. Add the localhost link just after the <head> tag, then open React DevTools. You should see the following in the Components section:

Creating a User Listing
Once you have connected React DevTools to your application, you can use the various features it provides. These features include the ability to inspect the component tree, examine component state and props, and profile component performance.
As the sample application doesn’t have many components, you’ll only see the App component in the tree. To explore more features of React DevTools, you’ll need to add more components.
To add a User component, create a file named User.js in the src folder and add the following code to it:
This component displays user information, such as first name, last name, age, and date of birth (DOB).
You’ll now create a UsersList component that utilizes the User component to display the list of users. Create a file named UsersList.js in the src folder and add the following code to it:
To populate the list of users, you need to create some dummy data and wrap the UsersList component in the App component. To do this, replace the code in App.js with the following:
Note: The App component renders the UsersList component, which in turn renders each User component for every user in the list.
The application in your Safari browser should look like the following:

Debugging and Inspecting Your App
Now that your application is ready, you can start debugging it with React DevTools.
If you open React DevTools, you should see your application tree. It begins with the App component at the top, followed by the UsersList component, and ends with the User component:

If you click the UsersList component in the tree, the props that are passed to the component will be displayed in the right pane. In this case, the props include the array of users from your dummy data:

Clicking a User component displays the props that it passes (the user object in this case). You can click any of three User components and check their relative props:

When you use React DevTools to debug your application, it’s important to understand the application tree and how it represents the component hierarchy. The application tree can help you quickly identify rendering issues and data flow by providing a visual representation of the components. You can inspect the props and state of each component to pinpoint bugs and troubleshoot issues that may arise.
Additionally, you can pin the location of a selected component in your browser by clicking the eye icon in React DevTools:

Once this has been activated, it will highlight the component in light blue in your browser:

You can also log the selected component in the console by clicking the bug icon in React DevTools:

The following image shows the results in the browser when you click the bug icon:

Using React DevTools, you can gain a better understanding of the structure and behavior of your applications. You can also more easily identify and fix bugs and performance issues. The standalone version is particularly useful because it can be used with any React application, whether it’s running locally or on a remote server, and it provides a separate, dedicated window for debugging purposes. Overall, the standalone version of React DevTools is a practical tool for developing and debugging React applications.
Differences between Standalone React DevTools and the Chrome Extension
If you use the standalone version of React DevTools, you’ll be able to use it with any browser, not just Safari. It also offers more customization options and flexibility compared to the Chrome extension. The following are some other differences between the two versions:
- Cross-platform compatibility: The standalone version of React DevTools is designed to work across various platforms, including browsers and devices, enabling a broader range of debugging and development possibilities. Chrome extensions, on the other hand, are limited to working within the Chrome browser environment.
- Ease of setup and connection: Chrome extensions are designed to integrate seamlessly with the browser, so using the extension version makes it easy to detect and connect to React apps running in the browser. The standalone version of React DevTools often requires manual configuration to connect to the target app, which can be more time-consuming and error-prone.
- Updates and maintenance: These two versions of React DevTools may have different release schedules and update processes. Chrome extensions typically update automatically with the browser, while the standalone version may require manual updates.
Limitations of Standalone React DevTools
It’s also important to be aware that the standalone version of React DevTools has some limitations. For instance, the tool may not work as effectively with certain types of components, such as those built with third-party libraries. You may need to use additional tools or methods to gather the necessary information if the tool provides limited data.
The following are some of the most notable limitations:
- Browser-specific features: The standalone version of React DevTools may lack some browser-specific features, such as network request inspection, JavaScript debugging, or browser performance profiling. For these features, developers need to use the browser’s built-in developer tools or rely on other debugging solutions tailored for the specific browser.
- Integration with browser environment: The standalone version doesn’t have the same level of integration with the browser environment as the extensions. Certain tasks, like interacting with browser APIs or manipulating the DOM, may be more challenging or impossible to accomplish using the standalone version.
- Learning curve: Due to differences in features, interface, and setup process, developers may need to invest additional time in learning how to use the standalone version of React DevTools. This may slow down their development process, especially if they are already familiar with the Chrome extension.
- Performance and resource usage: The standalone version of React DevTools may have different performance characteristics and resource usage compared to the Chrome extension version. Depending on the specific tools and configurations used, developers may experience varying levels of performance and resource consumption, which can impact their development experience.
By keeping these limitations in mind, you can adjust your approach and optimize your code more effectively. For instance, you can use alternative tools or workarounds to gather the information you need.
The standalone version of React DevTools offers a versatile solution for developers who need a powerful and flexible set of debugging tools, whether they’re working on browser-based React apps or non-browser-based applications like React Native apps.
This article introduced the standalone version of React DevTools and demonstrated how to use it to debug a React app running in Safari. You should now be comfortable with setting up, connecting, and using React DevTools to inspect and debug your React applications. With the knowledge from this article, you’ll be able to debug your React applications, regardless of the environment or browser they are running in.
You can find the code that was used in this article in this GitHub repository .
By Lucien Chemaly
Lucien has a Master's and Engineering Degree in IT and Telecommunications from the University of Rennes, France. He teaches seasonal courses for engineering students at the Saint Joseph University of Beirut and has been involved in programming training for private companies. He also writes for Draft.dev.

Build a Blog that Software Developers Will Read
The Technical Content Manager’s Playbook is a collection of resources you can use to manage a high-quality, technical blog:
- A template for creating content briefs
- An Airtable publishing calendar
- A technical blogging style guide
Popular Articles
- Redux Query Vs React Query (Dec 07, 2023)
- Redux Saga Vs Redux Thunk Difference (Dec 07, 2023)
- Redux-Thunk Vs Redux-Saga Which Is Better (Dec 07, 2023)
- Redux And Local Storage (Dec 07, 2023)
- Redux And Flux (Dec 07, 2023)
Redux Browser Extension
Switch to English
Table of Contents
Introduction
Features of the redux devtools extension, installation and setup, tips and tricks, common errors and solutions.
- State Inspection: It allows you to inspect the current state of your application and how it changes over time.
- Action Inspection: You can inspect the actions dispatched by your application, including the action type, payload, and the state before and after the action was dispatched.
- Time Travel: This feature lets you jump to different points in time in your application's state history, essentially 'undoing' and 'redoing' actions.
- Action Dispatching: You can manually dispatch actions to test how your application responds.
- Filter Actions: If your application dispatches a lot of actions, the log can get crowded. You can filter actions by their types to focus on the actions you are interested in.
- Preserve Log: By default, the extension clears its state when you refresh the page. You can prevent this by enabling the 'Persist State' option.
View in English
Meet Safari Web Extensions on iOS
Safari extensions
Enhance and customize the web browsing experience on iPhone, iPad, and Mac with Safari extensions. Using powerful native APIs and frameworks, as well as familiar web technologies such as HTML, CSS, and JavaScript, you can easily create Safari extensions in Xcode and distribute them on the App Store in the Extensions category. Xcode 12 and later supports the popular WebExtension API and includes a porting tool to make it easy to bring your extensions to Safari.

Blocking content
Give users the ability to block certain content types on Safari iOS, iPadOS, and macOS. Built with Xcode, these app extensions are designed for speed and don’t slow down browsing. And because extensions never see what webpages users visit, user data is protected.
Learn about content blockers
Web extensions
Extend the web-browsing experience by allowing Safari to read and modify web page content. Now supported in iOS 15 and iPadOS 15, Safari web extensions are available on all Apple devices that support Safari. These extensions are built with Xcode and can communicate and share data with native apps — so you can integrate app content into Safari or send web data back to your app to create a unified experience.
Learn about Safari web extensions
Distributing and managing extensions
The Extensions category on the App Store for iPhone, iPad, and Mac showcases Safari extensions, with editorial spotlights and top charts to help people discover and download great extensions from the developer community. When your Safari extension is ready to be released, upload it to App Store Connect for distribution on the App Store. Apple reviews all extensions and updates to ensure they work reliably. Before submitting for review, make sure to read the guidelines for extensions .
Get started with App Store Connect
Converting extensions from other browsers
Web extensions that work in browsers other than Safari can be converted to support Safari on Apple platforms. Run the command-line web extension converter to create an Xcode project configured with a macOS app and/or iOS or iPadOS app that includes an extension that can be enabled in Safari.
Learn about converting a web extension for Safari
Upgrading macOS Safari web extensions to support iOS and iPadOS
It's easy to upgrade an existing macOS Safari web extension to also support iOS and iPadOS. Simply rerun your project through the command-line web extension converter tool with the --rebuild-project option. This will create a new Xcode project based on your existing project that includes extensions for these platforms.
# Using and Creating Extensions
Extensions are one of the most powerful features of Redux. Any part of Redux can be overloaded to do virtually anything with extensions.
Table of Contents
- Loading an Extension
- Redux::get_extensions()
- Extension Folder Structure
WARNING: Extensions must be loaded BEFORE you use them
For best results, always load your extension before attempting to reference them in a config. Some extensions have custom APIs that will not be included and thus results may be poor. Always load extensions first, then use them.
# Loading an Extension
Using the Redux API, loading a single extension or a folder of extensions is simple.
That's it! Redux will recognize your extension(s) for your instance. You may then begin using their functionality in your config code.
If multiple extensions are in use, ensure they are loading properly in their own named folders within the specified directory to load them all.
# Fetching Extensions
Sometimes you need to fetch the existing extensions to identify what is being used.
# Redux::get_extensions()
This method requires one or two parameters depending on the desired return value.
# Fetching all Extensions
This returns an array of loaded extensions containing key/pair information of path (the path to the extension) and class (the classname of the extension). False is returned on failure.
# Fetching a Single Extension
Use the following to fetch the path of a single extension:
# Creating a Custom Extension
Creating your own extension is simple. In fact, to change the way a Redux field works, an extension solution is preferred to modifying the core code.
(opens new window) included in the sample folder.
# Extension Folder Structure
All extensions must follow a similar structure.
← Getting Help/Support Using TGM Plugin Activation →
browser-redux
- 8 Dependencies
- 0 Dependents
Browser App and Extension Boilerplate using Redux Actions
Simple boilerplate and library for building Chrome apps and cross-browser extensions (support for Firefox and Safari will come later) that use Redux actions instead of messaging.
Redux states are synced between background, inject page, app window, extension popup and badge.
The developing is the same as for the web apps with React and Redux, just use the src/app boilerplate. If you need some extension or Chrome app customizations, use src/browser/ boilerplates.
The app example is edited from Redux Counter example using Redux Persist , based on React Chrome Extension Boilerplate .
- browser-redux-sync : states syncing module.
- browser-redux-bg : messaging module - send redux actions (from popup, windows or inject pages) to be called in the background by their function name.
- src/app : React cross-browser application.
- src/browser : sources for the extension and Chrome app.
- test/app : tests for Redux actions and reducers, and for React components (using Legit Tests ).
- test/chrome : tests for Chrome app and extension (using chromedriver , selenium-webdriver ).
- react-redux
- redux-persist
- redux-devtools
- redux-logger
- redbox-react
- react-chrome-extension-boilerplate
- react-transform-hmr
- react-transform-catch-errors
- babel-plugin-react-transform
Installation
Development.
You can load unpacked extensions with ./dev .
React/Flux hot reload
This boilerplate uses Webpack and react-transform , and use Redux . You can hot reload by editing related files of Popup & Window. If the inject page is on https (like https://github.com ), click the 'shield' icon on the Chrome address bar to allow loading http://localhost there (after making any changes in dev mode), so hot reload can work for that page.
Build extension
Build firefox extension.
Note that it's not possible for now to load Firefox extensions from local directories , so use npm run compress:firefox instead to generate an xpi file.
Build & Compress ZIP file
- Load the extension to Chrome .
- Launch your Chrome app .
- Firefox: Prerequisites , Installing .
- Chrome extension
- Firefox extension (see the current status )
- Safari extension (based on Chrome to Safari port )
- boilerplate
Package Sidebar
npm i browser-redux
Git github.com/zalmoxisus/browser-extension-boilerplate
github.com/zalmoxisus/browser-extension-boilerplate
Downloads Weekly Downloads
Last publish.
9 years ago
Collaborators
How-To Geek
How to sync a redux store across browser tabs.

Your changes have been saved
Email is sent
Email has already been sent
Please verify your email address.
You’ve reached your account maximum for followed topics.
I've Been Using My Phone as a Laptop (Here's What I've Learned)
How to use robocopy to sync files on a drive or directory in windows, 6 ways onedrive is better than google drive, quick links, synchronising your store, customised synchronisation, integrating with redux-persist.
Redux is a convenient way to manage state in complex web apps. Your Redux store isn't synced across tabs though, which can lead to some awkward scenarios. If the user logs out in one tab, it would be ideal for that action to be reflected in their other open tabs.
You can add cross-tab store synchronisation using the react-state-sync library. This provides a middleware which automatically syncs the store across tabs. You don't need to manually intervene in the sync process after the initial setup.
The Redux State Sync library offers a Redux middleware which you need to add to your store. When the store receives an action, the middleware will dispatch the same action in any other tabs open to your site.
Each tab sets up its own message listener to receive incoming action notifications. When the listener is notified, it will dispatch the action into the tab's store.
Messages are exchanged between tabs using the Broadcast Channel API . This is a browser feature which allows tabs from the same origin to communicate with each other. Tabs "subscribe" to "channels." They're notified by the browser when another tab posts a message to a subscribed channel.
Broadcast Channel is only available in newer browsers. Redux State Sync uses an abstraction which can fallback to alternative technologies. When Broadcast Channel is unsupported, IndexedDB or LocalStorage will be used instead.
The use of Broadcast Channel places some limitations on what you can send between tabs. Data you dispatch must be supported by the browser's structured clone algorithm . This includes scalar values, arrays, plain JavaScript objects and blobs. Complex values will not be transferred exactly.
To start using Redux State Sync, add it to your project via npm:
npm install redux-state-sync
Next, create a basic store. We'll modify this code in a moment to add Redux State Sync.
import {createStore} from "redux";
const state = {authenticated: false};
const reducer = (state, action) => ({...state, ...action});
const store = createStore(reducer, state);
Now we have a simple store. To sync it across tabs, add the Redux State Sync middleware and setup a message listener.
import {createStore, applyMiddleware} from "redux";
import {createStateSyncMiddleware, initMessageListener} from "redux-state-sync";
const reduxStateSyncConfig = {};
const store = createStore(
applyMiddleware(createStateSyncMiddleware(reduxStateSyncConfig))
initMessageListener(store);
The store is now ready to use across tabs. Open your site in two tabs. Dispatch an action in one of the tabs. You should see the action appear in both stores, effecting the corresponding state change in each. The Redux DevTools extension can be used to monitor incoming actions and the state changes they cause.
The state sync middleware is created using the createStateSyncMiddleware() utility function. This accepts a config object used to customise Redux State Sync's operation. We'll look more closely at this in the next section.
After the store is created, it's passed to initMessageListener() . This function ensures the cross-tab listening is configured. Without this call, tabs may not receive new actions if no action was dispatched on first load.
Using initMessageListener() won't give your tab access to the existing store held in another tab. When the user opens a new tab, it'll default to having its own fresh store. If you want new tabs to get their state from an open tab, use the initStateWithPrevTab() function instead.
const store = createStore(reducer, state, applyMiddleware(createStateSyncMiddleware({})));
initStateWithPrevTab(store);
The store's state will be replaced with the existing state if there's another open tab available.
Redux State Sync supports several configuration options to let you customise the synchronisation. Here's some of the most useful settings. Each one is set as a property in the config object passed to createStateSyncMiddleware() .
Excluding Actions
Sometimes you'll have actions which you don't want to synchronise. An example could be an action which causes a modal dialog to appear. Chances are you don't want this dialog to show up in all the user's open tabs!
You can exclude specific named actions using the blacklist option. Pass an array of action names as the value.
const config = {
blacklist: ["DEMO_ACTION"]
// This won't be synced to any other tabs
Store.dispatch({type: "DEMO_ACTION"});
You can also use a whitelist instead of a blacklist. Set the whitelist config option to allow only predefined actions to be synchronised.
Precisely Filtering Actions
If neither blacklist or whitelist give you enough control, set the predicate option. This accepts a function which is used to filter synchronisable actions.
predicate: action => (action.type !== "DEMO_ACTION")
The function will be invoked each time a new action is received. It'll receive the action as a parameter. The function should return true or false to indicate whether the action should be synchronised to other tabs. The example above will synchronise every action except DEMO_ACTION .
Broadcast Channel Settings
You can change the name of the Broadcast Channel by setting the channel property. It defaults to redux_state_sync . You shouldn't usually need to change this unless you want to have two separate synchronisation routines.
You can pass options to the Broadcast Channel abstraction library by setting broadcastChannelOption . This should be a configuration object accepted by the pubkey/broadcast-channel library .
You can use this to force a particular storage technology to be used. In this example, synchronisation will always occur via IndexedDB, even if the browser has native support for Broadcast Channels.
broadcastChannelOption: {type: "idb"}
You'll often want to use Redux State Sync in conjunction with Redux Persist. Redux Persist is a popular library which automatically persists your Redux store in the browser.
When using Redux Persist, you don't need to use Redux Persist's initStateWithPrevTab() function. Use initMessageListener() instead, as the initial state will always be the persisted state provided by Redux Persist.
Blacklist Redux Persist actions within your Redux State Sync configuration. These don't need to be synchronised across tabs. You should only sync changes that actually affect the store, rather than actions related to its lifecycle.
blacklist: ["persist/PERSIST", "persist/REHYDRATE"]
Redux State Sync lets you synchronise user actions across tabs. The applications are virtually boundless and are likely to improve the user experience. As users take actions on your site, they'll be immediately reflected in their other open tabs.
The "classic" use case is synchronising login and logout outcomes. There are other benefits too though, such as making incoming notifications available to all tabs, or synchronising client-side preferences like the user's selected UI theme.
The minified redux-state-sync library weighs in at 19KB. With setup consisting of just a few extra lines of code, you should consider adding Redux State Sync to your next project. It lets you link tabs together into a cohesive whole, instead of having them exist as independent entities.
- Programming
- My extensions & themes
- Developer Dashboard
- Give feedback

Redux DevTools
720 ratings
Redux DevTools for debugging application's state changes.
The extension provides power-ups for your Redux development workflow. Apart from Redux, it can be used with any other architectures which handle the state. This is an open source project. See the official repository for more details: https://github.com/reduxjs/redux-devtools
4.6 out of 5 720 ratings Google doesn't verify reviews. Learn more about results and reviews.

Douglas Baker Sep 1, 2024
It was not working in my Chrome browser on the first couple of attempts. I could open it via inspect but there was no activity showing, despite dispatches and it was just stuck on "init". After shutting the browser down and restarting the app in VS code, it was alive. Great tool now that it is working!

Huy Hiếu Nguyễn Aug 20, 2024

Arman__ Khan Aug 12, 2024
it's very useful, Thanks!
- Version 3.2.4
- Updated September 4, 2024
- Report a concern
- Offered by Redux DevTools
- Size 1.2MiB
- Languages English
- Developer Email [email protected]
- Non-trader This developer has not identified itself as a trader. For consumers in the European Union, please note that consumer rights do not apply to contracts between you and this developer.
This developer declares that your data is
- Not being sold to third parties, outside of the approved use cases
- Not being used or transferred for purposes that are unrelated to the item's core functionality
- Not being used or transferred to determine creditworthiness or for lending purposes
For help with questions, suggestions, or problems, visit the developer's support site

Node.js V8 --inspector Manager (NiMV3)
Manages DevTools with Node V8 Inspector (node --inspect) Debugging Workflow

Angular state inspector
Helps you debug Angular component state. Supports Angular 1/2+/Ivy!

Immutable.js Object Formatter
Makes Immutable JS objects more readable when they are logged to the console.

Allow CORS: Access-Control-Allow-Origin
Easily add (Access-Control-Allow-Origin: *) rule to the response header.

React Developer Tools
Adds React debugging tools to the Chrome Developer Tools. Created from revision ccb20cb88b on 7/3/2024.

React Context DevTool
Devtool for React Context and useReducer

JSON Formatter
Makes JSON easy to read. Open source.

Angular DevTools
Angular DevTools extends Chrome DevTools adding Angular specific debugging and profiling capabilities.

GraphQL developer tools
Devtools panel for GraphQL development
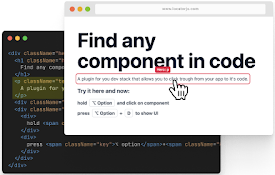
LocatorJS Chrome Extension - option-click to code (ReactJS)

React Performance Devtool
A devtool extension for inspecting the performance of React components.

Testing Playground
Simple and complete DOM testing playground that encourage good testing practices.
Navigation Menu
Search code, repositories, users, issues, pull requests..., provide feedback.
We read every piece of feedback, and take your input very seriously.
Saved searches
Use saved searches to filter your results more quickly.
To see all available qualifiers, see our documentation .
- Notifications You must be signed in to change notification settings
How I got React Devtools working in Safari Developer Tools in 2022
fycdev/react-devtools-in-safari-2022
Folders and files, repository files navigation, react devtools in safari 2022, introduction.
This is a successful experiment in getting React DevTools working in Safari Developer Tools in Safari 16 as of September 2022. Potentially, this process can be used with other extensions that extend the developer tools (e.g. Redux, Vue, etc...).
This is only a proof of concept but hopefully this may open the doors for tools that were previously accessible on other browsers to be now available on Safari spurring for a more open web experience (and debugging) for developers.
Requirements
- MacOS 12+ (Monterey)
- Safari 16 (as of this date this would be Safari Technology Preview for your respective MacOS version)
Instructions
In summary, we will build Firefox's version of React DevTools, port that built version to Safari, make a few adjustments, and then install it in Safari Technology Preview.
Clone the React repository so we can build the Firefox React DevTools.
In the React directory, build the Firefox React DevTools
a. Download the build from their CI (alternatively, you can build from source).
No need to worry where the download is stored.
b. From the main react/ directory
This will output the built files (.zip folder and an unpacked folder) to packages/react-devtools-extensions/firefox/build .
c. Unzip the zip file to a project folder of your choosing. Remember the folder path as it will be needed shortly.
Convert the Firefox React DevTools using safari-web-extension-converter
Optionally, can use the --project-location flag to set the destination folder for the converted extension otherwise it will save it to the current directory.
manifest.json will need to be updated before the project is run. Xcode should automatically open the project once the conversion has been completed. Otherwise, open the project in Xcode.
a. Within the project, navigate to manifest.json (case sensitive). If none of the file names have been changed it should be under /React Developer Tools Extension/Resources/manifest.json .
b. Within the permissions property add "devtools" to the array.
Run the project by either pressing the "play" button or from the Menu Bar Product -> Run which will install the extension as an application. An app will open and will have a button to "Quit and Open Safari Extensions Preferences...". Ignore it and close the app.
Open Safari Technology Preview (since of this writing it is the only version with Safari 16).
a. In the Menu Bar enable:
- Develop -> Allow Unsigned Permissions
- Develop -> Experimental Features -> Web Inspector Extensions
b. Open Preferences and navigate to Extensions. React Developer Tools will be shown in the list given the process worked successfully. Enable it and allow the extension to run on any chosen website or all websites.
c. To uninstall, click the "Uninstall" button in the Extensions pane. Follow the prompt to open the folder. Navigate up the folders until React_Developer_Tools-somehash can be deleted.
Congratulations! React DevTools should now be working in Safari.
Converting a web extension for Safari
Adding a web development tool to Safari Web Inspector
10 Browser Extensions for Designers (and Non- Designers)

Many of us seek tips and tricks to simplify our work — designers included. Some tasks can be very simple but take a lot of time — for example, trying to figure out the exact colors in a competitor's color palette. Other tasks could require help from someone else — for example, proofreading your CV or portfolio.
We asked around the Uxcel team and made a list of browser extensions that both designers and non-designers like using. These 10 tools can save your time, money, and effort, inspire you, and boost your productivity and creativity.
- WhatFont for Chrome & Safari
- Grammarly for Chrome & Safari
- ColorZilla for Chrome
- Page Ruler Redux for Chrome
- FireShot for Chrome
- Dark Reader for Safari & Chrome
- HoverSee for Safari
- Muzli 2 for Chrome & Safari
- Evernote Web Clipper for Chrome & Safari
- Stay Focusd for Chrome
1. WhatFont for Chrome & Safari
.webp "safari extensions redux")
The WhatFont extension provides a simple and elegant way of identifying fonts on a web page. Forget hunting through the code and looking for a typeface that has caught your eye. Hover the mouse on the text — and voilà! WhatFont tells you what typeface it is. You can see even more details on click: font style, weight, size, line height, and color. WhatFont has 2 significant advantages: the extension exists for both Chrome and Safari, and it can identify typefaces in any language.
Try WhatFont for Chrome
Try WhatFont for Safari
If you’re intrigued by the world of fonts, explore our Typography course , at the end of which you’ll be able to create both aesthetic and readable designs.
2. Grammarly for Chrome & Safari
.webp "safari extensions redux")
Smaller teams often don't have full-time copywriters or UX-writers. In cases like this, the copy can become the designers' responsibility. You might need to write UX microcopy and social media posts, not to mention emails to your team. Also, the ability to write solid copy is a massive addition to your professional skill set. With Grammarly, you can stop worrying about spelling errors or weird sentence structure. This extension acts like your personal writing assistant. It underlines pieces that need improvement and provides immediate and specific suggestions.
Try Grammarly for Chrome
Try Grammarly for Safari
That said, AI tools cannot replace a strong foundational knowledge in UX writing — check out our UX Writing course to build yours.
3. ColorZilla for Chrome
%3B%20Color%20Picke%E2%80%AAr%E2%80%AC%20(safari).webp "safari extensions redux")
A sustainable, thoughtful color palette is the foundation of any design. ColorZilla is an extension with a range of features that are helpful when working with color. The most used function is "Pick Color From Page." It automatically determines the hex value of the color you choose and copies it to the clipboard, allowing you to paste it right away in the drawing tool. ColorZilla keeps a history of all the colors you've picked, so you won't lose track of your top selections. Moreover, the extension can generate website palettes and create gradients that you can download in CSS format.
ColorZilla doesn't work for Safari, but you can use its alternative — Color Picker. It speeds up the process of picking colors and copies their value in any format you need: NSColor, UIColor, HEX, RGB, etc.
Try ColorZilla for Chrome
Try Color Picker for Safari
Our Color Psychology course is a great place to start if you’re curious about how to use colors effectively in your designs.
4. Page Ruler Redux for Chrome
%3B%20Ruler%20for%20Safari.webp "safari extensions redux")
Page Ruler Redux is a go-to tool for designers and web developers when they need precise element measurements. All you have to do is drag the mouse along the selected area to measure the distance between elements. The tool will also give you accurate height and width in pixels.
For Safari users, there's the Ruler extension with similar functionality. Ruler can also display rulers, guides, and frames over website content, allowing you to save and load guides for future reviews.
Try Page Ruler Redux for Chrome
Try Ruler for Safari
5. FireShot for Chrome

The FireShot extension has over 2 million users, which speaks volumes to its excellent functionality. It's a Chrome extension that allows you to:
- Capture visible parts of web pages
- Select and capture specific areas
- Take screenshots of entire web pages
- Edit and print screenshots
- Save screenshots in various image formats, like PDF, JPEG, GIF, or PNG
- Email a screenshot right away or copy it to the clipboard
Safari users can have a look at Awesome Screenshot, which is a similar extension. It provides decent functionality and allows you to capture, edit, and share screenshots anywhere you want.
Try FireShot for Chrome
Try Awesome Screenshot for Safari
6. Dark Reader for Safari & Chrome
.webp "safari extensions redux")
If you have never worked late into the night, you're in the minority of designers. Isn't dark mode the best option for the darkest time of day? There's conflicting scientific evidence, but many people believe that dark mode reduces the negative impact of blue light. The blue light emitted by electronic devices is believed to cause eye strain, dry eyes, and severe migraines. The Dark Reader extension is a pet project of software engineer and accessibility activist Alexander Shutov who often works late and wanted to create a tool to ease eye tension in the dark.
With the Dark Reader extension, you can join the "dark side" regardless of the time of day. The tool allows users to adjust brightness, contrast, and font settings to make pages more readable. Plus, dark-themed websites look astonishingly elegant. The extension is available for both Safari and Chrome users.
Try Dark Reader for Chrome
Try Dark Reader for Safari
7. HoverSee for Safari
%20and%20Hover%20Zoom%20%2B%20(Chrome).webp "safari extensions redux")
HoverSee's functionality is right in its name — when users hover the mouse over images and links, they see them larger and more clearly. The extension also provides previews of videos and websites alongside available descriptions. And, of course, it's a lifesaver for users with visual impairments.
HoverSee works great for websites with extensive image galleries and direct image links — for example, Facebook and Twitter. On Youtube, the extension automatically plays a video in its expanded mode. The tool is very easy to customize. You can adjust video delay, min and max zoom, whitelist or blacklist certain websites, autoplay or mute videos, and more.
HoverSee is available for Safari users only, but Chrome has an alternative tool — Hover Zoom+.
Try Hover Zoom+ for Chrome
Try HoverSee for Safari
If building accessible and inclusive products like HoverSee intrigues you, consider exploring our Design Accessibility course .
8. Muzli 2 for Chrome & Safari
.webp "safari extensions redux")
You are probably familiar with creativity blocks. Sometimes you spend hours trying to produce something to no avail. As designers, we often look for sources of inspiration. For example, we read books, visit exhibitions, take different routes to the office or grocery store, try new hobbies, and stay up to date with the freshest design trends and news. With Muzli 2, you won't miss a thing in the design world and can always stay inspired. Once installed, it replaces your default home page. Every time you open the browser, Muzli 2 offers you a daily dose of beautiful designs, articles with helpful tips, exciting interviews, and freebies.
The Muzli 2 extension is made by the InVision app team — the creators of one of the best digital platforms for smooth team collaboration when designing products.
Try Muzli 2 for Chrome
Try Muzli for Safari
9. Evernote Web Clipper for Chrome & Safari
.webp "safari extensions redux")
The Evernote extension is a fantastic tool for those who like things to be neatly organized and sorted. If you often come across interesting articles or captivating headlines that you are too busy to read right away, Evernote has you covered. The creators of Evernote strive to reduce the number of open browser tabs, so the tool has been design to allow you to store all the interesting things that you find on the web in one place. You can also take screenshots, comment, highlight meaningful points, and share notes with your friends or colleagues.
Try Evernote for Chrome
Try Evernote for Safari
10. Stay Focusd for Chrome
%20%26%20Waste%20No%20Time%20(Chrome%20%26%20Safari).webp "safari extensions redux")
The secret to getting things done is not working 12 hours a day without shifting your eyes from the computer. It's about having regular and, most importantly, refreshing breaks. Procrastinating on Facebook or any other social media website won't do any good. The Stay Focusd extension has all the power to help you to, well, stay focused! For example, you can set limits for time-consuming websites. Once you reach a limit, the extension blocks access to that content for the rest of the day. It's similar to turning parental control on for yourself. The good news is that you can fully customize it yourself, too.
This extension isn't available for Safari users, but Waste No Time is a great alternative. It has the same functionality as Stay Focusd to help users stay on track and get things done.
Try Stay Focusd for Chrome
Try Waste No Time for Chrome & Safari
Other productivity hacks include creating task lists, getting enough sleep, taking breaks, and enjoying a hobby that takes your mind off work.
Frequently Asked Questions
Learn to master typography and create designs that are both readable and aesthetic.
Learn how to write UX copy that will tell a compelling story and engage users.
Learn about color psychology and the profound impact it has on design.
Upskill your design team effectively
Equip your design team with the best-in-class design training that sticks.
Do you know your design team skill level? Send them this quick test & see where their skills stand among 300K+ designers worldwide.
Level up your design career
Get step-by-step guide how to build or advance your UX design career.
Do you know your design skills level? Take a quick test & see where you stand among 300K+ designers worldwide.
Continue reading
How famous cartoons use colors for storytelling, top 7 resources for ux/ui designers for meaningful design inspiration, how to write a ux case study in 10 steps, cookie settings 🍪.
- Interactive UX learning for all levels
- 20+ UX courses and career paths
- Personalized learning & practice
Design-first companies are training their design teams. Are you?
- Measure & identify team skill gaps
- Tailor learning for your team’s needs
- Unlock extensive learning library
- Visualize team growth over time
- Retain your designers
- Quick Facts
- Sights & Attractions
- Tsarskoe Selo
- Oranienbaum
- Foreign St. Petersburg
- Restaurants & Bars
- Accommodation Guide
- St. Petersburg Hotels
- Serviced Apartments
- Bed and Breakfasts
- Private & Group Transfers
- Airport Transfers
- Concierge Service
- Russian Visa Guide
- Request Visa Support
- Walking Tours
- River Entertainment
- Public Transportation
- Travel Cards
- Essential Shopping Selection
- Business Directory
- Photo Gallery
- Video Gallery
- 360° Panoramas
- Moscow Hotels
- Moscow.Info
- Monuments and Memorials
- Memorials and victory monuments
Hero City Obelisk
The title "Hero City" was granted to the twelve cities of the Soviet Union that bore the brunt of the Nazi invasion during the Great Patriotic War (Second World War). St. Petersburg, then Leningrad, suffered as much as, if not more than, any other, withholding the appalling deprivations of the 900-day siege .
Among the many memorials to the heroism of the Soviet forces and the citizens of Leningrad, this towering obelisk on Ploshchad Vosstaniya, in front of the Moscow Railway Station , is probably the most visible. The site was originally occupied by an equestrian statue of Emperor Alexander III, erected in 1909. Removed in 1937, it now stands in the courtyard of the Marble Palace. For many decades, the centre of Ploshchad Vosstaniya stood empty until 1985, when this 36-meter grey granite column was unveiled on 8 May (on the eve of Victory Day celebrations).
Crowned with a bronze star, the column is itself star-shaped in cross-section, the first of its kind in the world. A bronze victory wreath encircles the lower part of the column beneath which oval haut-reliefs engraved with stirring patriotic slogans.
Accommodation near the Hero City Obelisk
Oktiabrskaya hotel, large standard hotel with a prime downtown location and good facilities, park inn by radisson nevsky, modern business hotel with prime downtown location on nevsky prospekt, avent inn hotel, basic accommodation at budget rates in the very centre of st. petersburg, purple gem in st. petersburg, elegant modern rental apartment on one of st. petersburg's prettiest streets, la casa di bury apartments, large and very well-equipped apartments to rent just off nevsky prospekt, apartment blizko, inexpensive studio apartment with fun interiors and great downtown location, graffiti l hostel, modern hostel with 130 beds and extensive services and good central location, friends hostel, friendly and welcoming hostel on nevsky prospekt near ploshchad vosstaniya, chillout hostel, laid-back, friendly hostel with a courtyard location near nevsky prospekt, dining near the hero city obelisk, big and bustling restaurant with trendy international menu and roof terrace, smart and stylish restaurant with good contemporary italian cuisine, tasty georgian food and homely atmosphere at enduring downtown eatery.
We can help you make the right choice from hundreds of St. Petersburg hotels and hostels.
Live like a local in self-catering apartments at convenient locations in St. Petersburg.
Comprehensive solutions for those who relocate to St. Petersburg to live, work or study.
Maximize your time in St. Petersburg with tours expertly tailored to your interests.
Get around in comfort with a chauffeured car or van to suit your budget and requirements.
Book a comfortable, well-maintained bus or a van with professional driver for your group.
Navigate St. Petersburg’s dining scene and find restaurants to remember.
Need tickets for the Mariinsky, the Hermitage, a football game or any event? We can help.
Get our help and advice choosing services and options to plan a prefect train journey.
Let our meeting and events experts help you organize a superb event in St. Petersburg.
We can find you a suitable interpreter for your negotiations, research or other needs.
Get translations for all purposes from recommended professional translators.
COMMENTS
In case you are using Nextjs framework, you can achieve this by opening the console in safari. Type window in it. Expand it. Now just check in the window object property. You will find a key something like '__REDUX' or something like that. In my case it was __NEXT_REDUX_STORE__.
React Safari Redux. A set of utilities for building Redux applications in Safari extensions. This is the Safari implementation of react-chrome-redux. Designed to be used in Safari extensions built with the Safari Extension Builder. Currently supports linking the extension background and content/injected scripts.
It would be amazing to get Redux / React dev tools in Safari to ditch Chrome, especially when relying on battery since it really makes a huge difference in battery life between Chrome and Safari nowadays. I use the stand alone react-devtools package. It took me a little bit of work to figure out how to include it in my webpack build, but then ...
How to Use React DevTools in Safari
This browser extension allows you to inspect and debug your Redux state and actions, leading to efficient development and less time spent on hunting down bugs. In this article, we will delve into the features, installation and usage of the Redux DevTools Extension, and share some tips and tricks to avoid common pitfalls.
it works properly both on chrome and safari but I can't use redux dev tool. If I change && to || (as below and it works on safari but not on chrome . window.__REDUX_DEVTOOLS_EXTENSION__ || compose Any one can figure out what wrong with my code. Because I need to use dev tool to trace the state of web app and run it on chrome and safari as well
Safari Extensions
In Safari 17 the extension generated by using the xcrun safari-web-extension-converter tool on the non-prod Firefox version of the extension only requires removing the chrome.notifications.onClicked reference in the background page script in order to get a fully working Redux DevTools.. So close, but I can image the distribution overhead that Apple requires for Safari extensions nowadays still ...
# Creating a Custom Extension. Creating your own extension is simple. In fact, to change the way a Redux field works, an extension solution is preferred to modifying the core code. Try it yourself using our extension boilerplate (opens new window) included in the sample folder. # Extension Folder Structure. All extensions must follow a similar ...
A Safari extension for Redux. Contribute to OKNoah/SafariReduxDevtoolsExtension development by creating an account on GitHub.
Browser App and Extension Boilerplate using Redux Actions. Simple boilerplate and library for building Chrome apps and cross-browser extensions (support for Firefox and Safari will come later) that use Redux actions instead of messaging. Redux states are synced between background, inject page, app window, extension popup and badge.
Now we will set up Redux DevTools extension step by step. 1.Adding Redux DevTools extension to our browser (Google Chrome) 2.Installing Dependencies for Redux DevTools & Adding Redux DevTools to ...
Redux DevTools is a browser extension that allows you to inspect, debug, and modify the state of your Redux application in real-time. It offers several features that make it an essential tool for ...
The Redux DevTools extension can be used to monitor incoming actions and the state changes they cause. The state sync middleware is created using the createStateSyncMiddleware() utility function. This accepts a config object used to customise Redux State Sync's operation. We'll look more closely at this in the next section.
3. I followed the instructions over at the official docs; my app was working just fine in chrome, pointing to localhost:3000. However, now Im running into an issue, because it seems that if a browser doesnt have Redux extension, it won't work. According to the docs, I have written out: import { createStore, applyMiddleware, compose } from "redux";
Redux DevTools - Chrome Web Store
Open Safari Technology Preview (since of this writing it is the only version with Safari 16). a. In the Menu Bar enable: Develop -> Allow Unsigned Permissions; Develop -> Experimental Features -> Web Inspector Extensions; b. Open Preferences and navigate to Extensions. React Developer Tools will be shown in the list given the process worked ...
Page Ruler Redux is a go-to tool for designers and web developers when they need precise element measurements. All you have to do is drag the mouse along the selected area to measure the distance between elements. The tool will also give you accurate height and width in pixels. For Safari users, there's the Ruler extension with similar ...
The Aquabus, also referred to as river tram or water taxi, is a public river transport system ferrying passengers along a fixed route to a set timetable. Despite the enormous distance covered by St. Petersburg's rivers and canals, there are currently only one inner-city line in operation. Reaching speeds of up to 80 km/h, the Aquabus really ...
St. Petersburg's newest railway station, Ladoga Station is a sprawling modern building to the east of the downtown area, about 2km across the Neva River from the eastern end of Nevsky Prospekt. Ladozhskaya Metro Station, connected to the mainline concourse, is on the orange metro line, four stops from Dostoevskaya in the very centre of the city.
Sytny Market is located on the Petrograd side and is St. Petersburg's oldest market, dating back to 1710. Sytny offers fresh produce, fish, meat, sundries and more. Located on UIitsa Nekrasova in the historic centre, this Soviet-era market sells the standard range of market produce, and lacks the charm of other historic St. Petersburg markets.
Leningrad - Hero-City Obelisk on Ploshchad Vosstaniya. Among the many memorials to the heroism of the Soviet forces and the citizens of Leningrad, this towering obelisk on Ploshchad Vosstaniya, in front of the Moscow Railway Station, is probably the most visible. The site was originally occupied by an equestrian statue of Emperor Alexander III ...